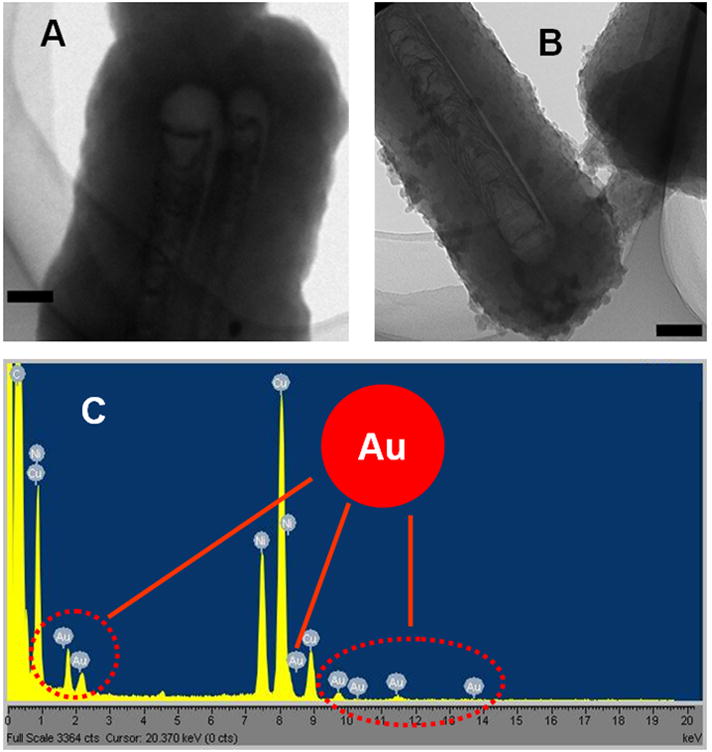
Fig. 2.

Transmission electron microscopy of PPy only (A) and AuNP-doped PPy (B) on ACNTs. The area marked with a red circle in B was subjected to EDX characterization (C). Red arrows in C indicate the peaks of Au. The scale bar shown in A and B is 100 nm.
