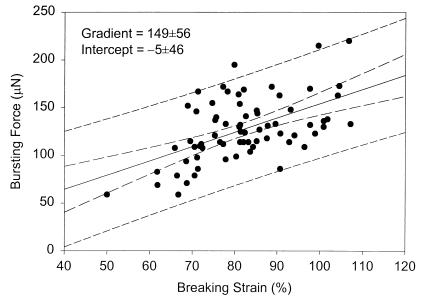
Figure 5.
Correlation between the force required to burst a single cell and the cell-wall breaking strain for exponential-phase S. cerevisiae Y9 (13.4-h sample). A similar trend was found for stationary-phase cells (37.8-h sample). Dashed lines represent 95% confidence intervals on the mean and individual observations.

