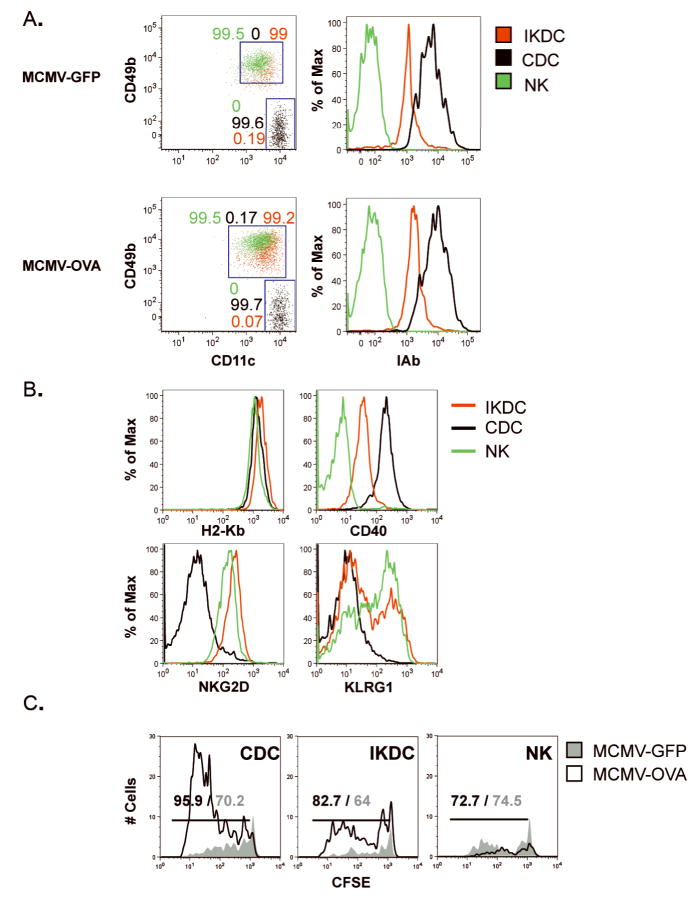
Figure 6. IKDC derived from MCMV-infected mice cross-presented viral antigens to CD8+ T-cells.
C57BL/6 mice were infected i.p. with 4×10⁵pfu MCMV/OVA or MCMV/GFP. Splenic IKDC (CD11cintCD49b+I-Abhi), CDC (CD11chiCD49b−I-Abhi) and NK (CD11cintCD49b+I-Ab−) were sorted at day 2 p.i. A, Purity of FACS-sorted IKDC (red), CDC (black), and NK (green). Left dot plots represent an overlay of the CD49b/CD11c staining for these populations. The percentages of each population are indicated above each of the two gates CD49b+CD11cint (IKDC and NK) and CD49−CD11chi (CDC). The differential expression of MHC-II (I-Ab) used to sort IKDC, CDC and NK is shown in overlaid histograms. B, Each population was stained for MHC-I (H2-Kb), CD40, NKG2D, and KLRG1. C, DEAD assay. Ex vivo sorted cell populations were mixed with CFSE-labeled CD8+ OT-I at a ratio of 1APC:3T-cells. CFSE dilution was assessed by FACS after 4d-incubation. Percentages of proliferating T-cells within gate are indicated for cultures containing stimulators derived from mice infected with MCMV/OVA (black) or MCMV/GFP (grey).

