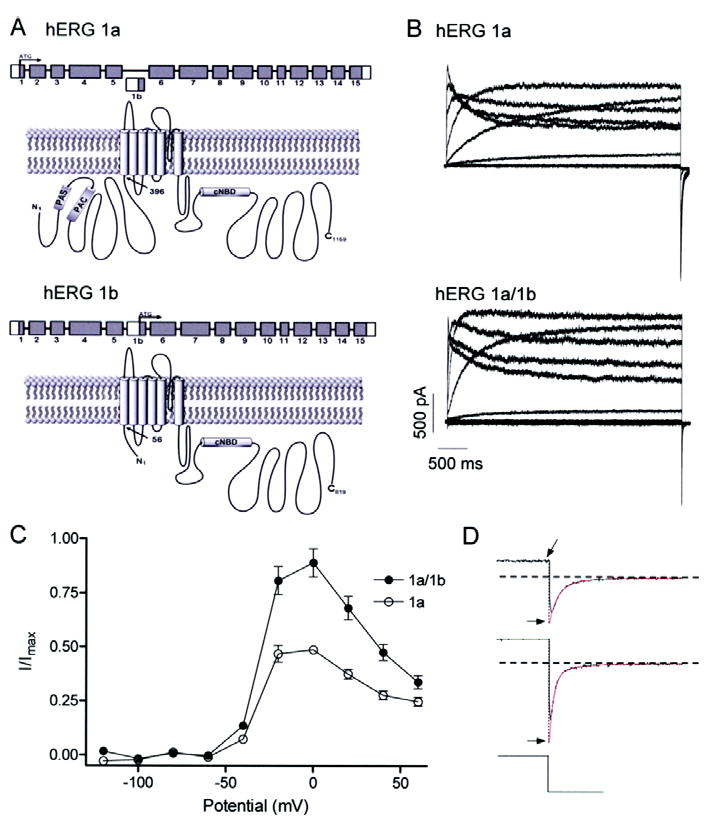
Fig 1.

Greater amplitude currents for hERG 1a/1b compared to hERG 1a channels. A, graphic showing N-terminal differences in primary structure between hERG 1a (upper) and hERG 1b (lower). Cytoplasmic N and C termini flank the hydrophobic core. N-terminal differences yield subunits of 1159 and 819 amino acid residues for hERG 1a and 1b, respectively. “PAS”, Per-Arnt-Sim domain; “PAC”, PAS-associated C-terminal domain; “CNBD”, putative cyclic nucleotide binding domain; “TCC”, tetramerization coiled-coil domain. B, currents from stably transfected hERG 1a cells (upper) or hERG 1a stable cells transiently transfected with hERG 1b (lower). All currents were recorded at 34 ± 2°C in response to series of 4-s depolarizing voltage steps ranging from -120 to 60 mV followed by a 5-s repolarizing step to -50 mV. C, steady state current-voltage relations of hERG 1a and hERG 1a/1b channels, both displaying the hallmark negative slope conductance (n = 5 - 6 for both). The currents at the end of each depolarizing pulse were normalized to the absolute value of the extrapolated maximum tail current and plotted as a function of membrane potential. D, double exponential fits (in red) of tail currents evoked following a step to 60 mV extrapolated back to the moment of voltage change to obtain peak current value (Imax; see Methods).
