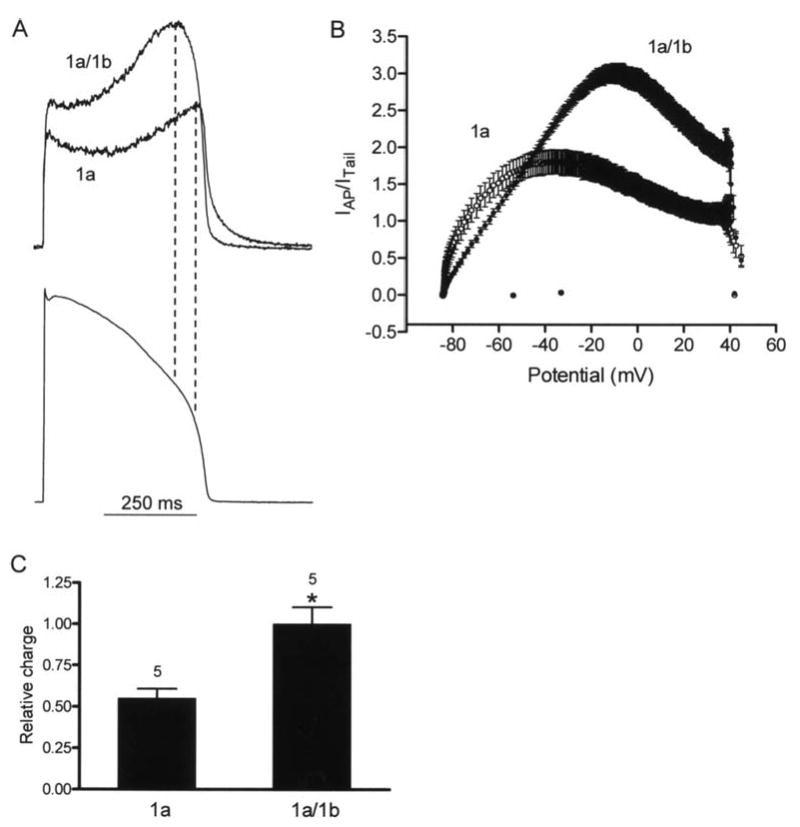
Fig 2.

hERG 1a and 1a/1b currents during cardiac action potential clamp. A, upper panel, representative current profiles of hERG 1a/1b and 1a channels recorded at 34 ± 2°C. Currents were normalized to peak tail currents elicited at -105 mV following a prepulse to 60 mV to compare current amplitudes and differences in rectification for a given channel density. Lower panel, voltage command was a digitized rabbit ventricular action potential as previously described 10. B, real-time I-V plots of current for 1a/1b and 1a channels during action potential clamp. Each point is the mean ± s.e.m of five cells. C, relative charge transferred during an action potential command. Values were obtained by integrating the normalized current traces (432.4 ± 45.9 and 786.6 ± 80.7 for 1a and 1a/1b, respectively) and were plotted with an additional normalization to the 1a/1b values. * indicates P < 0.05, Mann Whitney test.
