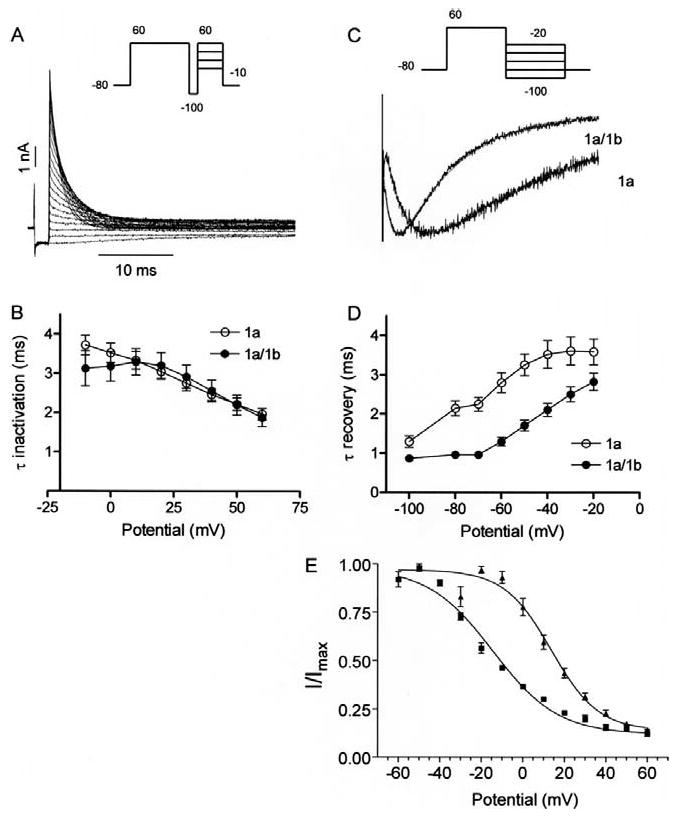
Fig 4.

Inactivation properties of hERG 1a and 1a/1b channels. A, hERG currents elicited by the three-pulse protocol to measure the time course of inactivation. A 500-ms pulse to 60 mV to activate and then inactivate hERG is followed by a 2 ms pulse to -100 mV to remove the inactivation. In the third pulse varying the potential between -10 and 60 mV allowed the inactivation time course to be measured as a function of voltage. B, the time constants for onset of inactivation are estimated by fitting the decay of the currents in the third pulse to a single exponential function and plotted as a function of test potential. There were no significant differences in the time constants of inactivation for hERG1a and hERG1a/1b channels. Each point is the mean ± s.e.m of four to six cells (P > 0.05, Mann Whitney test). C, exemplary tail currents with double exponential fits (red) showing faster recovery from inactivation for hERG 1a/1b compared with hERG 1a channels. Tail currents were evoked by a step to -105 mV following a 4-sec, 60 mV pulse. D, plot quantifying data showing recovery from inactivation is faster in hERG 1a/1b compared with hERG 1a channels. Time constants were measured as the single exponential fit to the rising phase (> -80 mV) or as the fast time constant of a double exponential fit (≤ -80 mV) to the tail current. Each point is the mean ± s.e.m of seven to eight cells (P < 0.05, Mann Whitney test). Temperature was 34 ± 2°C. E, steady-state inactivation plot showing shift of V1/2 between hERG 1a and 1a/1b currents. Currents were measured at +40 mV following a series of 2-ms steps to a range of voltages from a holding potential of +40 mV.
