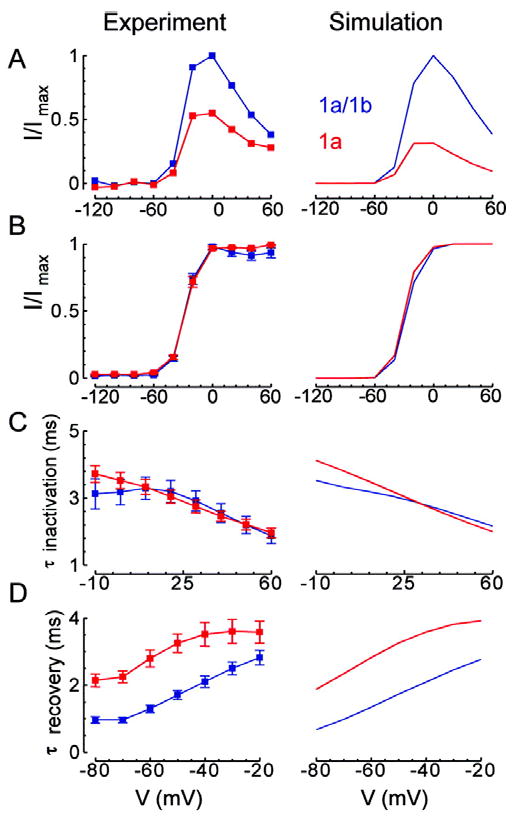
Fig 7.

Voltage-dependent behavior. Left column shows experimental results and right column shows corresponding simulation results. hERG 1a/1b is in blue and hERG 1a is in red. A, Step current. Plot shows relative current at the end of 4 seconds at the indicated potentials from a -80 mV holding potential divided by the extrapolated peak tail current at -105 mV. Results are normalized to the maximum for hERG 1a/1b. B, Steady-state activation. Plot shows normalized maximal tail currents at steps to -105 mV following a 4 second step to the indicated potentials from a -80 mV holding potential. For computation of steady state activation, movement from state i to state c1 was not allowed in order to prevent artifactual recovery to c1 instead of o at the most depolarized potentials. C, Time constant for inactivation. We fit decay of the currents elicited by steps to the indicated potentials following a 500 ms step to 60 mV then a 2 ms step to -100 mV from a -80 mV holding potential. D, Time constant for recovery from inactivation. We fit decay of currents elicited by steps to the indicated potentials following a 500 ms step to 60 mV from a -80 mV holding potential.
