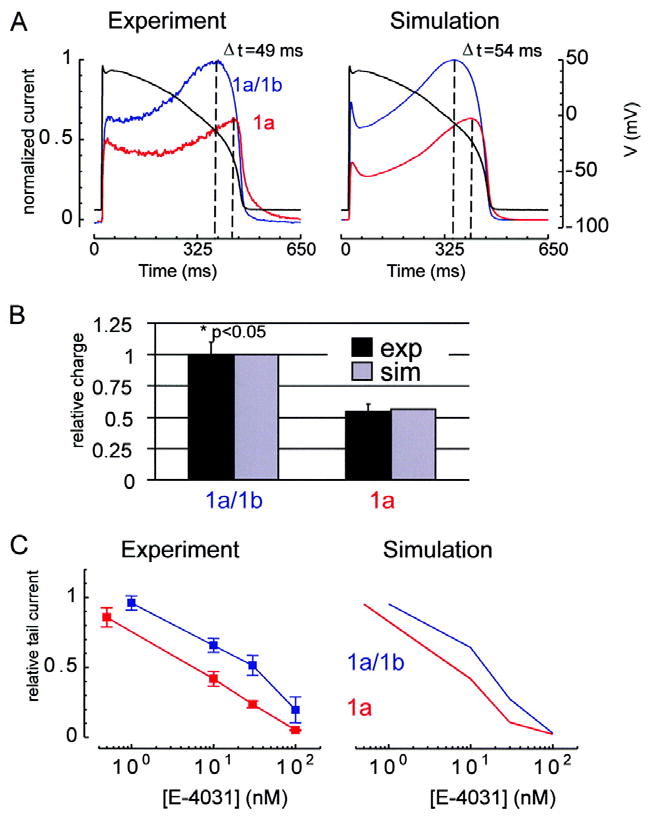
Fig 8.

Action potential voltage clamp and E-4031 drug sensitivity. hERG 1a/1b is in blue and hERG 1a is in red. For panels A and C, the left column shows experimental results and the right column shows corresponding simulation results. A, Action potential voltage clamp. Shown are current responses (scale to the left of panel) to the voltage-clamp waveform (black, scale to the right of panel). Results are normalized to the maximum for hERG 1a/1b. The difference in time at which maximum current occurs for hERG 1a/1b versus hERG 1a is reproduced by the simulations (experiment: Δt = 49 ms; simulation: Δt = 54 ms). B, Experiments show that hERG 1a/1b contributes significantly more charge during the action potential than hERG 1a (p<0.05, Mann Whitney test, n=5, s.e.m. error bars). Relative charge is measured by integrating the current and dividing by the value obtained for hERG 1a/1b. Simulations (gray) agree with experiments (black). C, Dose-response curve for E-4031. Tail currents were elicited by 5 second steps to -50 mV following 4 seconds at 20 mV from a 15 second -80 mV holding step. We plot tail currents at the 20th cycle of this protocol divided by that for the 1st cycle for various E-4031 doses.
