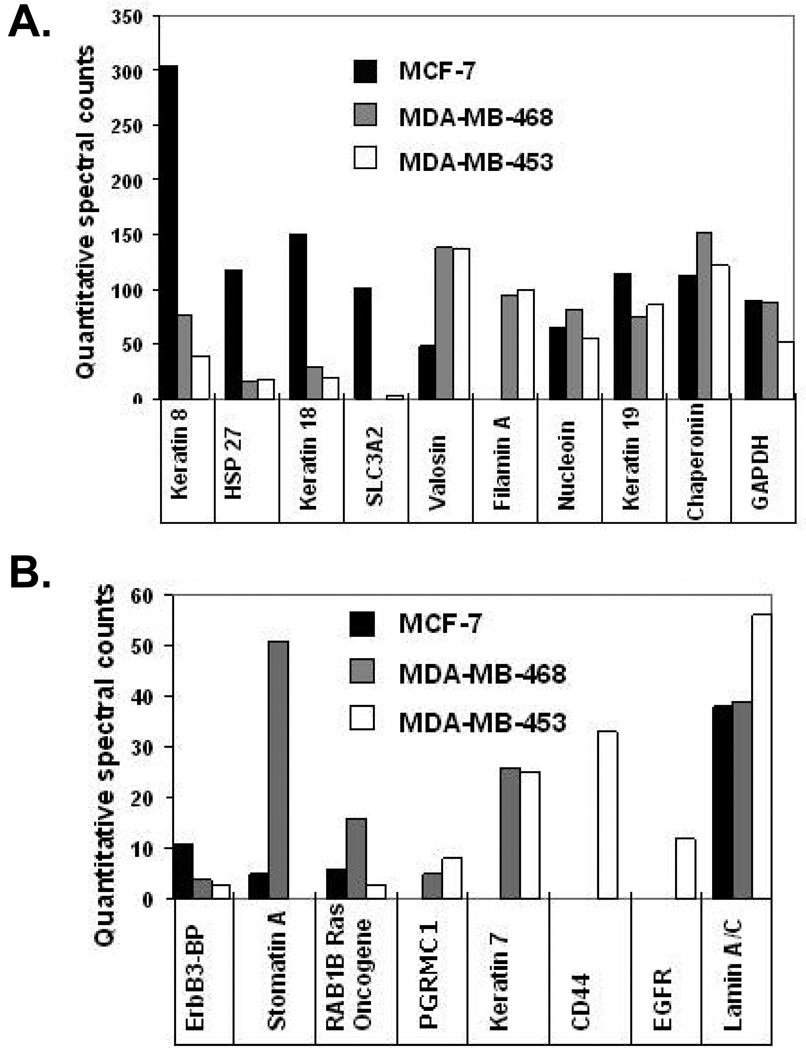
Figure 5.
Compilation of proteins highlighting the relative quantitative spectral counts of distinct proteins found in the membrane fractions of MCF-7 (black bar), MDA-MB-453 (grey bar), and MDA-MB-468 (white bar) breast cancer cell lines. A) Spectral count scale is 0–350 counts for proteins. B) Spectral count scale is 0–60 counts for proteins. Each bar represents quantitatively normalized spectral counts of 3 separate experiments for each breast cancer cell line complied in the software program scaffold.

