Figure 2.
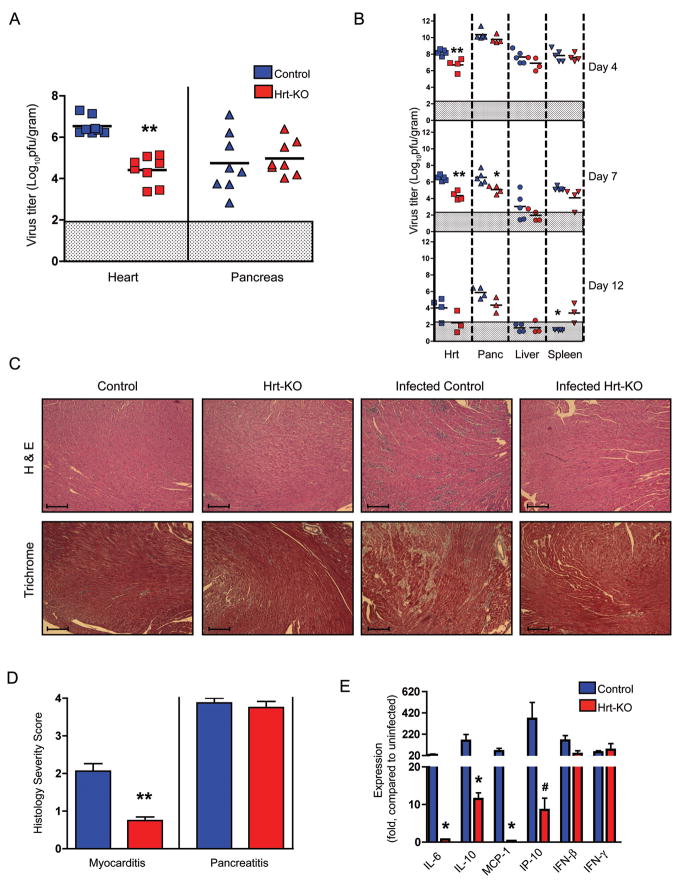
Reduced virus titers and myocarditis in Hrt-KO mice. A) Mice were infected with 1×10⁵ PFU/mouse of CVB3-H3, and sacrificed 7 days post-infection. Each symbol represents the titer (PFU per gram of tissue) from an individual mouse. Means for each experimental group are indicated by horizontal black lines (n= 8 for each genotype). B) Serial titers in mice infected with 1×10⁵ PFU (n=3–5 mice per experimental group). C) Hematoxylin and Eosin (H & E, top) and Masson’s Trichrome stain (bottom) of heart tissue sections. Uninfected samples are shown in the left-hand panels; sections from infected mice (day 7) are shown on the right. Scale bars, 80 microns. D) Severity scores for myocarditis and pancreatitis in control (n=8) and Hrt-KO mice (n=8), assessed as described in Experimental Procedures. E) Differential induction of cytokine and chemokine expression in heart tissue 7 days post infection (1×10⁵ PFU), measured by quantitative RNA PCR. Expression is measured relative to uninfected control mice of the same genotype. Error bars are SEM, and asterisks indicate a statistical difference between the Hrt-KO and controls (*, p<0.05; ** p<0.005; #, p= 0.058).

