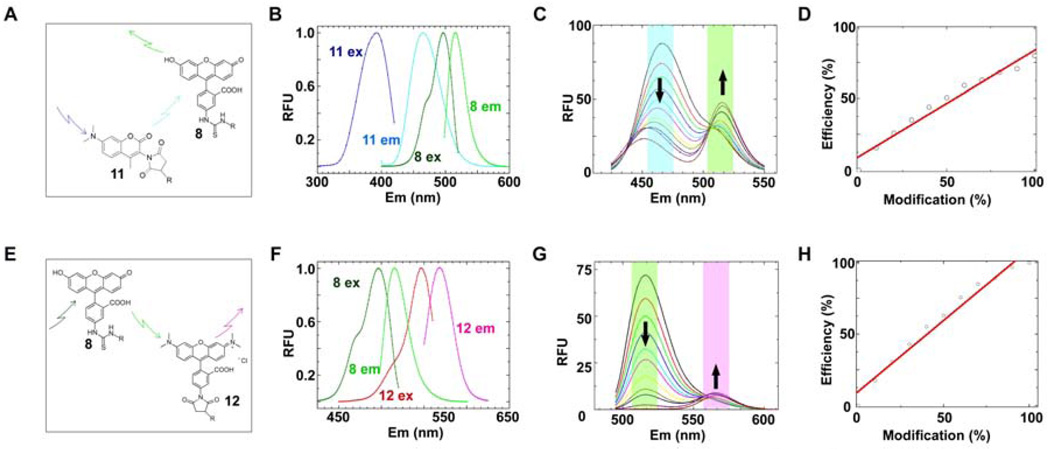
Fig. 4. Probe selection and photophysical evaluation of the crypto-YbbR peptides.
DACM-mCoA 11 and TAMRA-mCoA 12 probes were evaluated for their FRET characteristics with FITC-YbbR 8. (A) DACM-mCoA 11 acts as a FRET donor to FITC-YbbR 8. (B) Excitation and emission spectra of probes 11 and 8 were recorded and normalized to determine the spectral overlap of 11 emission with 8 excitation to calculate an overlap integral J(λ) [Eq. (3)] and theoretical Forster’s radius R0 [Eq. (2)] of this system. Summation of the normalized data gave a J(λ) of 1.60 × 10⁻¹³cm4 and a R0 =38Å. (C) FRET characterization of the crypto-DACM-FITC-YbbR peptide. Equimolar solutions of 11 and 8 were prepared with varying degree of modification to the crypto-DACM-FITC-YbbR 7, and their fluorescent spectra recorded with excitation at 403nm. The spectra are overlayed, and increase in 10% increments of modification from 0 to 100%; starting from the maximal emission observed at 462nm to minimum at this wavelength. (D) Eq. (5) was fitted to emission data from (C) and gave an efficiency of transfer value of 0.82. (E) FITC-YbbR 8 acts as a FRET donor to TAMRA-mCoA 12. (F) Excitation and emission spectra of probes 11 and 12 were recorded and normalized to determine the spectral overlap of 11 emission with 12 excitation to calculate an overlap integral J(λ) [Eq. (3)] and theoretical Forster’s radius R0 [Eq. (2)] of this system. Summation of the normalized data gave a J(λ,) of 3.01 × 10⁻¹³cm4 and a R0 =56Å. (G) FRET characterization of the crypto-TAMRA-YbbR peptide. Equimolar solutions of 11 and 12 were prepared with varying degree of modification to the crypto-TAMRA-YbbR 7, and their fluorescent spectra recorded with excitation at 475nm. The spectra are overlayed, and increase in 10% increments of modification from 0 to 100%; starting from the maximal emission observed at 513nm to the spectrum with the minimum value at this wavelength.
(H) Eq. (5) was fitted to emission data at 513nm from (G) and gave an efficiency of transfer value of 0.99.

