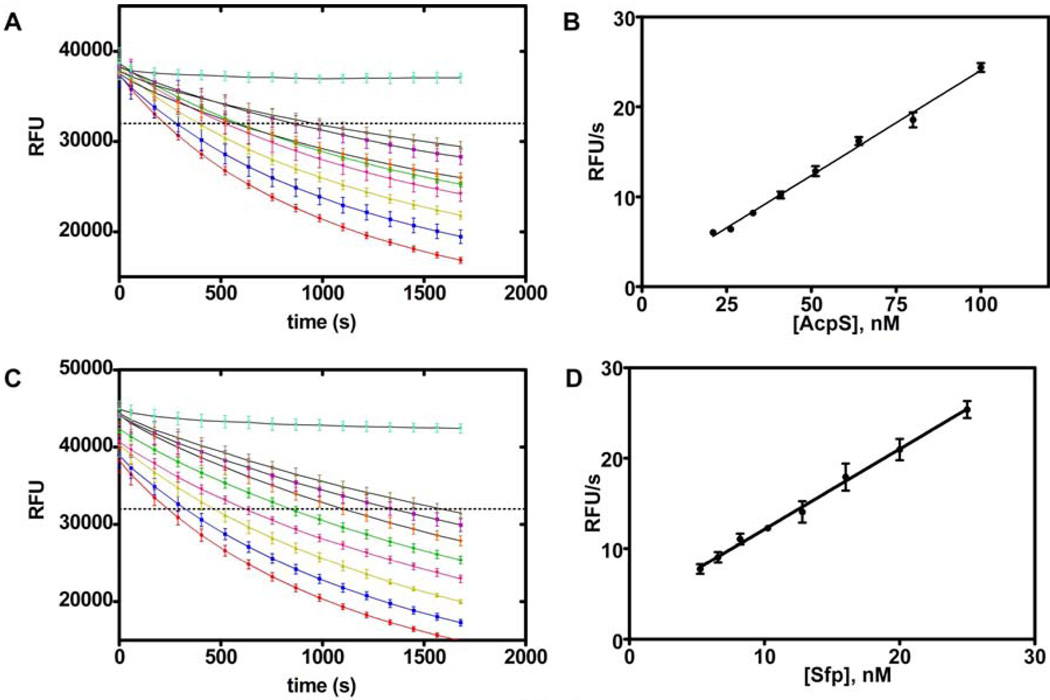
Fig. 5. Reaction progress and enzyme titration.
(A) Reaction progress plots for eight concentrations of AcpS. Rates were determined for the experiments when they intersect the dashed threshold at 32,000 RFU. (B) Reaction rates for the progress curves in A are plotted against AcpS concentration and demonstrate a linear response. (C) Reaction progress curves for eight concentrations of Sfp. Rates were determined for the experiments when they intersect the dashed threshold at 32,000 RFU. (D) Reaction rates for the progress curves in C are plotted against Sfp concentration and demonstrate a linear response.

