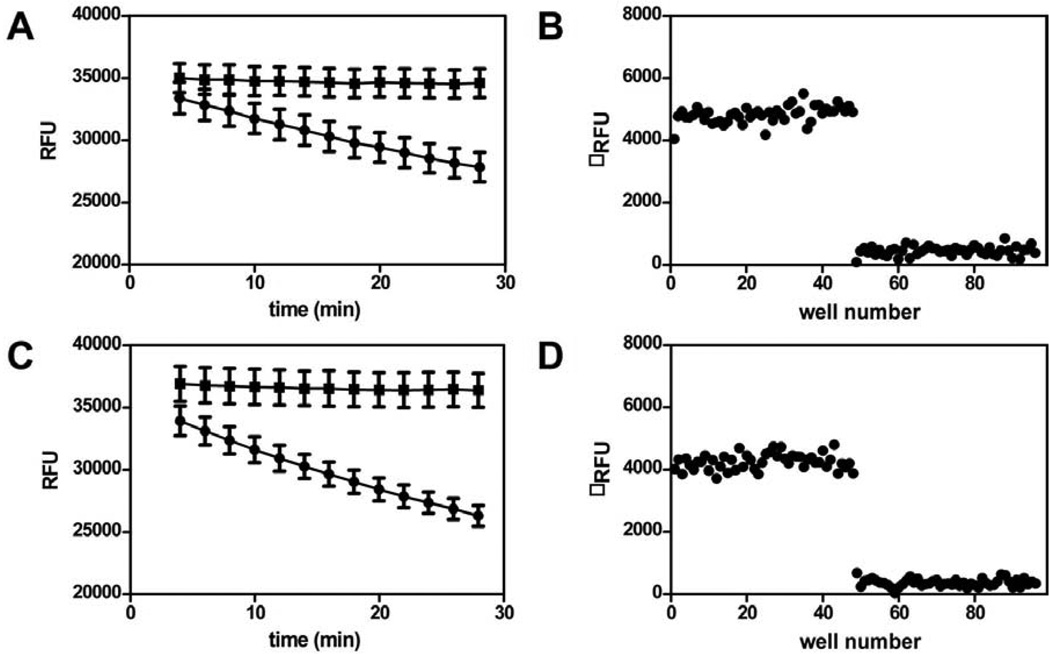
Fig. 6. Determination of analysis timepoint and Z’.
(A) Progress curve for a 96 well plate containing 48 reactions in the presense (●) or absence (▪) of 50 nM AcpS The data for each timepoint were analysed statistically and presented in Table 2. The 24 minute time point was selected for routine analysis, as it gave acceptable assay statistics during the linear range of the screen. (B) Change in relative fluorescence units for the 24 minute time point (Table 2, boxed data) is plotted against well number. The Z’ value for this data is 0.72. (C) Progress curve for a 96 well plate containing 48 reactions in the presense (●) or absence (▪) of 12.5 nM Sfp. The data for each timepoint were analysed statistically and presented in Table 2. The 16 minute time point was selected for routine analysis, as it gave acceptable assay statistics during the linear range of the screen. (B) Change in relative fluorescence units for the 16 minute time point (Table 2, boxed data) is plotted against well number. The Z’ value for this data is 0.71.

