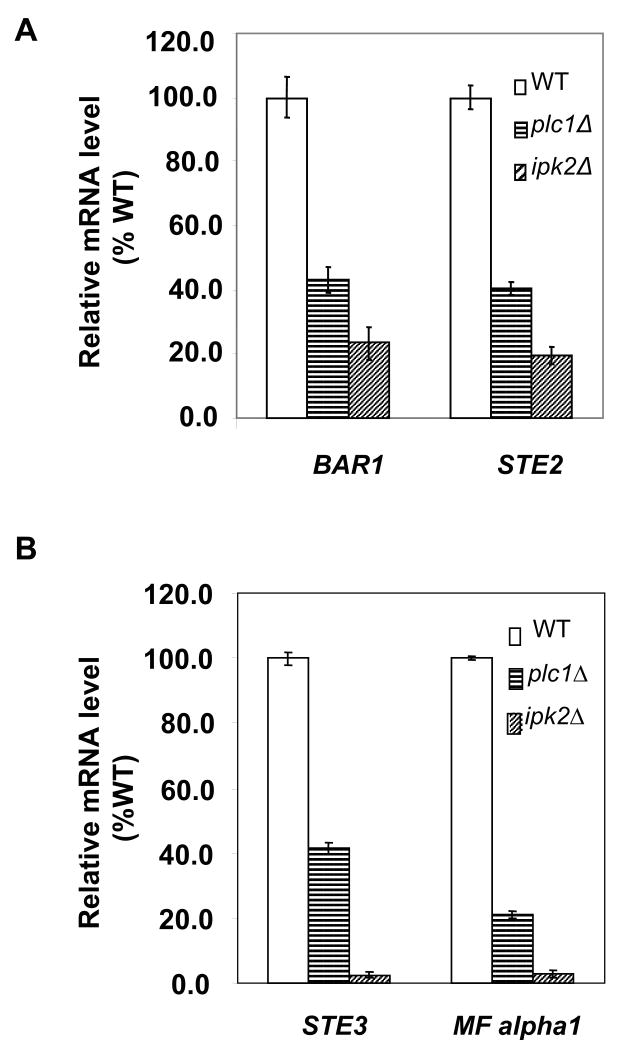
Figure 2. plc1Δ cells display reduced expression of cell-type-specific genes.
The indicated strains were grown in YPD medium at 30°C to A600nm=1.0 and the total RNA was isolated and assayed for ACT1, BAR1, STE2, STE3, and MF alpha 1 transcripts by real time RT-PCR. The results were normalized to ACT1 RNA and expressed as relative values in comparison to corresponding WT strain. The experiment was repeated three times and the results represent means ± S.D. (A) Expression of a – specific genes BAR1 and STE2 in Mata cells. (B) Expression of α – specific genes STE3 and MF alpha1 in MATα cells.

