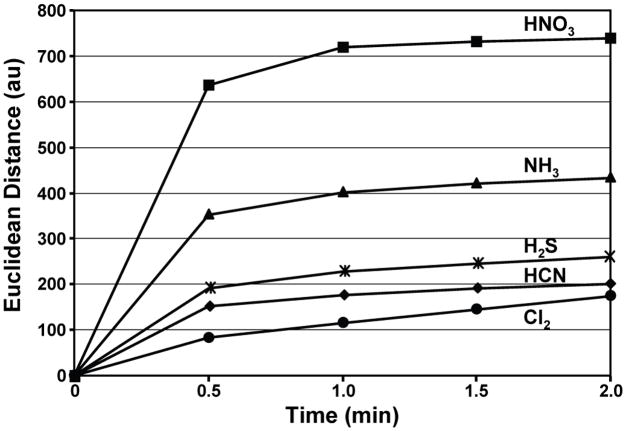
Fig. 4. Response time of the array.
Total Euclidean distance of the array is plotted versus time for five representative TICs at their IDLH concentrations; the average of seven trials is shown. The Euclidean distance is simply the total length of the 108-dimensional color difference vector, i.e., the total array response.

