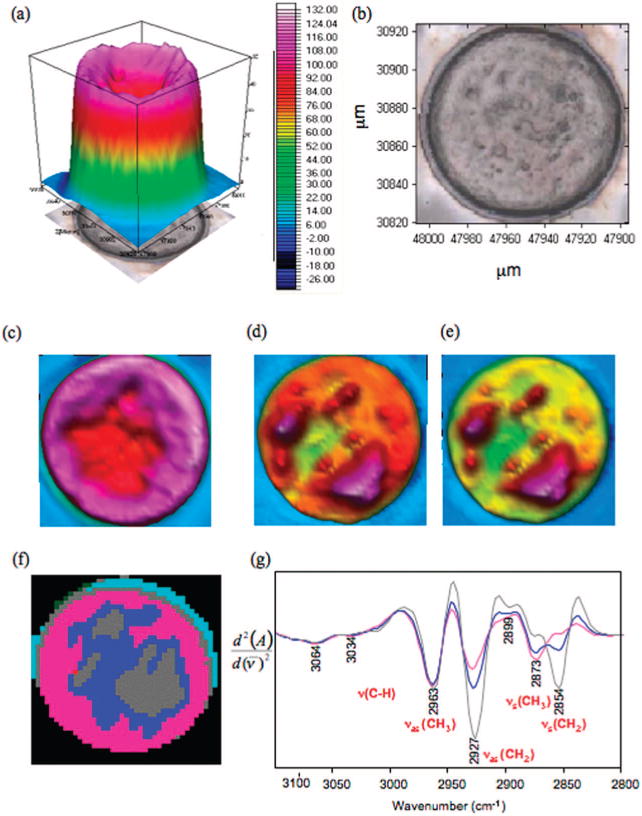
Figure 2.

FT-IR synchrotron map of MII cell: (a) Total absorbance map, 1800−1000 cm−1. (b) Photomicrograph of an MII cell. (c) Integrated areas of amide I mode. (d) Integrated area of CH stretching region. (e) Integrated area of ester carbonyl band. (f) False color five cluster map generated by performing (UHCA on the CH stretching region (3100−2800 cm−1). (g) Mean extracted spectra from each cluster color coded to match the UHCA map.
