
Figure 4.
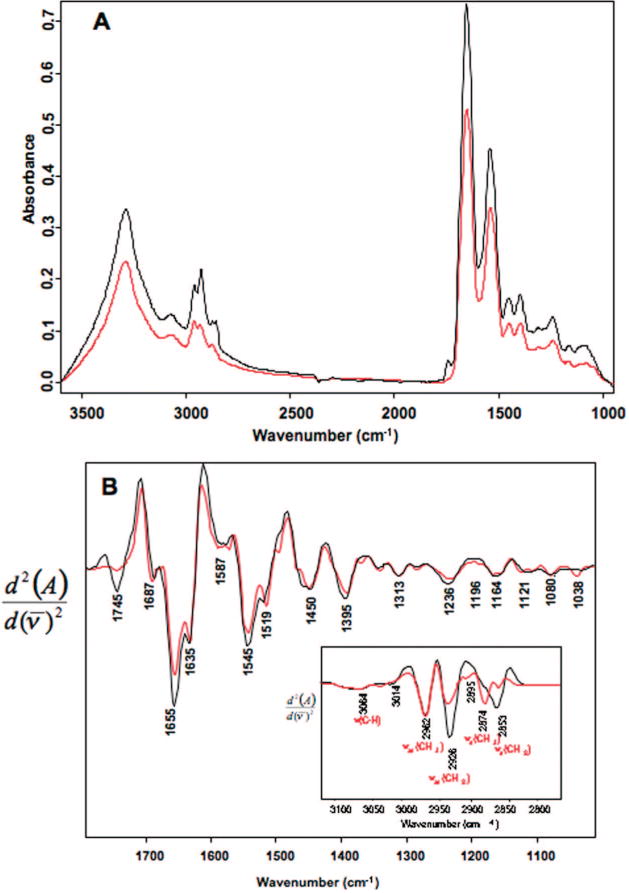
(A) Mean FT-IR synchrotron spectra calculated from line scans recorded of 90 GV (red) and 93 MII (black) cells showing major band assignments for the CH stretching region. (B) Second derivative spectra calculated from the mean spectra presented in part A.