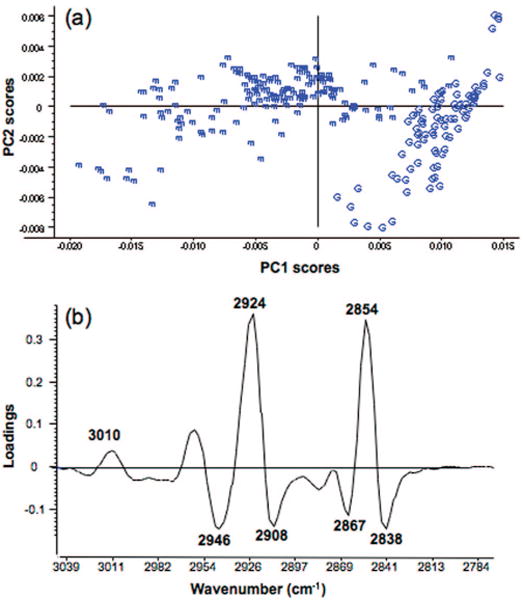
Figure 5.

Principal component analysis PC1 and PC2 scores plot showing a clear separation between GV (G) and MII (m) cells along PC1. The PCA decomposition was performed on 265 spectra which included 173 averaged spectra extracted from the line scans of 90 MII cells and a further 92 averaged spectra collected from the line scans of 92 GV cells from 4 independent trials. The PCA was performed in the CH stretching region (3050−2780 cm−1) on second derivative spectra. (b) Corresponding PC1 loadings plot showing strong positive loadings for the vas(CH2) and vs(CH2) modes at 2924 and 2854 cm−1 associated with the MII cells and strong negative loadings for vas(CH3) and vs(CH3) at 2946 and 2867 cm−1 associated with the GV cells.
