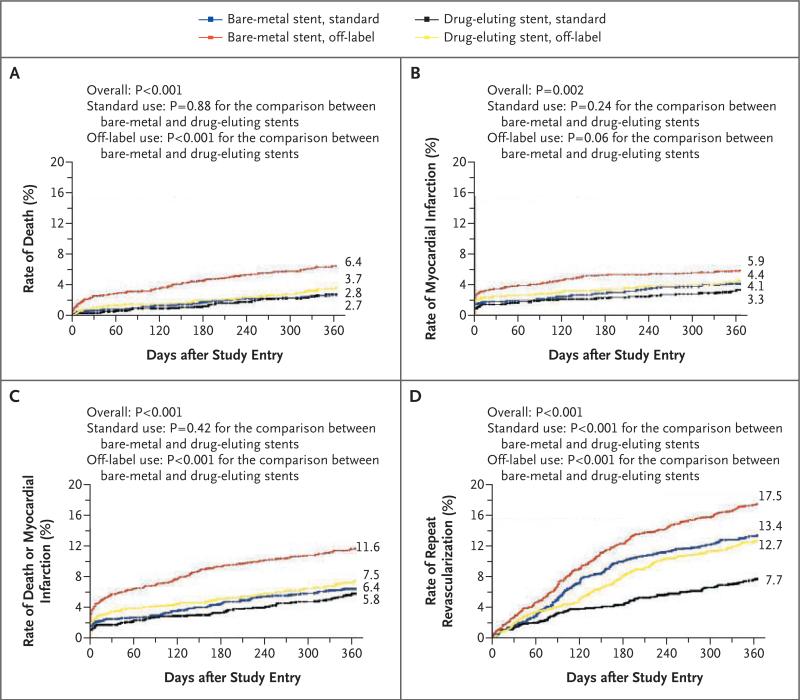
Figure 1. Kaplan–Meier Curves for Outcome According to Stent Type (Drug-Eluting vs. Bare-Metal) and Label Indication (Off-Label vs. Standard Use).
Panel A shows the 1-year incidence of death, Panel B the 1-year incidence of myocardial infarction, Panel C the 1-year incidence of the composite end point of death or myocardial infarction, and Panel D the 1-year incidence of repeat revascularization (percutaneous coronary intervention or coronary-artery bypass grafting).

