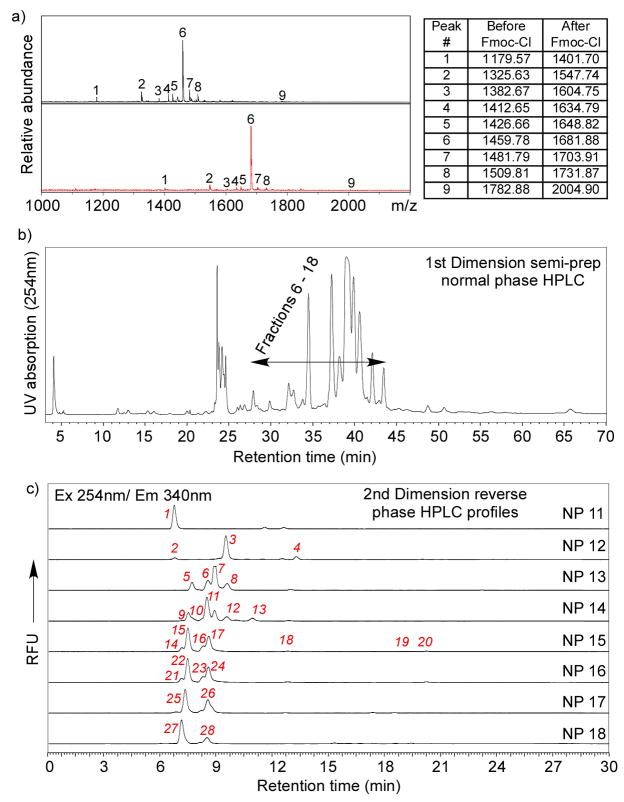
Figure 5.
Generation of a tagged glycan library from horseradish peroxidase (HRP): a) MALDI-TOF spectra of Pronase treated HRP before (top) and after (bottom) FmocCl treatment, where the minor component (Hex)3(HexNAc)2(Xyl)1(Fuc)1-Asn-Arg was shown to be the dominant peak; b) The first dimensional normal phase HPLC; c) The second dimensional C18 reverse phase HPLC with all of the 2D fractions marked. The scale of the Y-axis of each profile was individually adjusted to show the minor peaks. The relative abundance was calculated based on re-quantification of each 2D fraction.

