Figure 2.

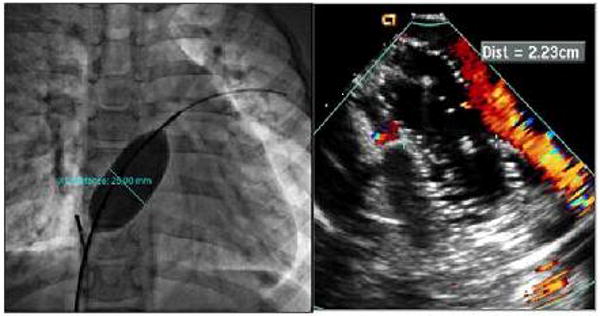
Cine fluoroscopic image and corresponding ICE image during balloon sizing of the defect. Left, cine fluoroscopy image demonstrating the balloon size of the defect. Right, ICE image during sizing indicating cessation of shunt.

Cine fluoroscopic image and corresponding ICE image during balloon sizing of the defect. Left, cine fluoroscopy image demonstrating the balloon size of the defect. Right, ICE image during sizing indicating cessation of shunt.