Fig. 6.
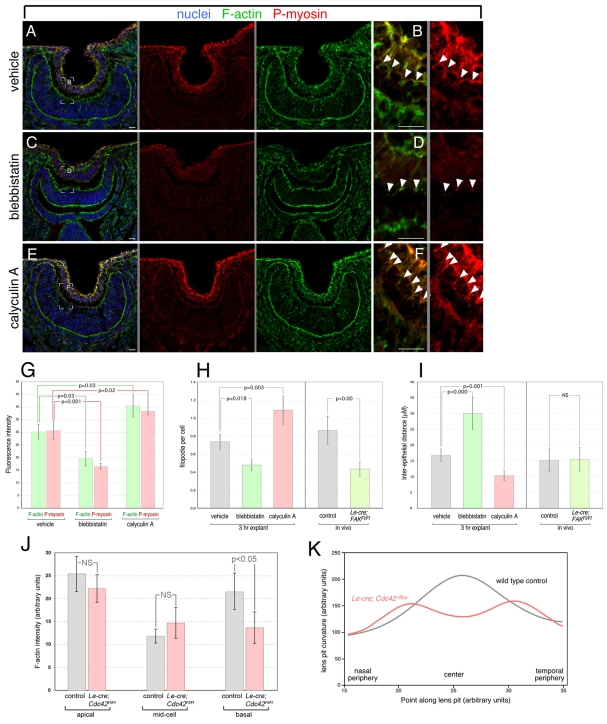
Lens-retina filopodia control inter-epithelial distance and lens pit curvature via actin-myosin contractile activity. (A-F) Eye region cryosections from E10.5 mouse embryo heads cultured for 3 hours in the presence of vehicle (A,B), blebbistatin (C,D) or calyculin A (E,F) and labeled for nuclei with Hoechst 33258 (blue), F-actin (green), and phospho-myosin II (red). The position of phospho-myosin labeling in B, D and F is indicated by arrowheads. A gray line between panels indicates that they are separated color channels of the same image. (G-I) Quantification of lens pit F-actin (green bars) and phospho-myosin (red bars) fluorescence intensity (G), filopodial index (H) and inter-epithelial distance (I) in the eyes of explanted embryo heads after vehicle, blebbistatin or calyculin A treatment. For all data points, n=5. In H and I, data from Le-Cre; FAKflox/flox mutants is represented from Fig. 4 for comparison purposes. (J) Quantification of lens pit F-actin labeling intensity at apical, middle and basal cell positions for E10.5 control and Le-Cre; Cdc42flox/flox mutants as labeled. For all data points, n=5. (K) Quantification of basal position rate of change of curvature from the nasal to temporal side in E10.5 control and Le-Cre; Cdc42flox/flox lens pits. n=6. Scale bars: 20 μm.

