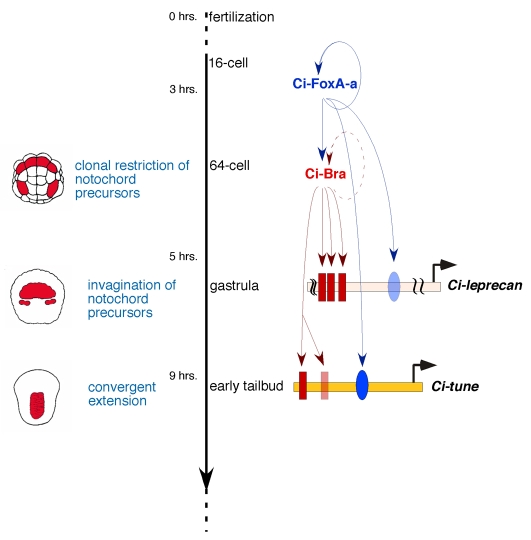
Fig. 8.
Model for the synergistic function of Ci-FoxA-a and Ci-Bra during ascidian notochord development. Model for the interactions between Ci-FoxA-a and Ci-Bra at the level of individual notochord CRMs during ascidian development. On the left side are schematic representations of embryos at the 64-cell (top), gastrula (middle) and early tailbud (bottom) stages. Notochord cells and their precursors are colored in red. The main events in notochord formation (blue font) are plotted against the developmental timeline (black vertical arrow) for Ciona embryos at the temperature of 18°C. Two CRMs controlled by Ci-FoxA-a and Ci-Bra, Ci-leprecan (Dunn and Di Gregorio, 2009) and Ci-tune, are depicted as horizontal colored bars. Red rectangles symbolize sites bound in vitro by Ci-Bra, blue ovals indicate sites bound in vitro by Ci-FoxA-a. Faded colors are used to indicate sites that play minor or no role in notochord activity. Circular arrows indicate autoregulatory loops on the transcription factor promoters, either demonstrated (continuous line) or inferred (dotted line). For simplicity, the Ci-FoxA-a and Ci-Bra CRMs are omitted.

