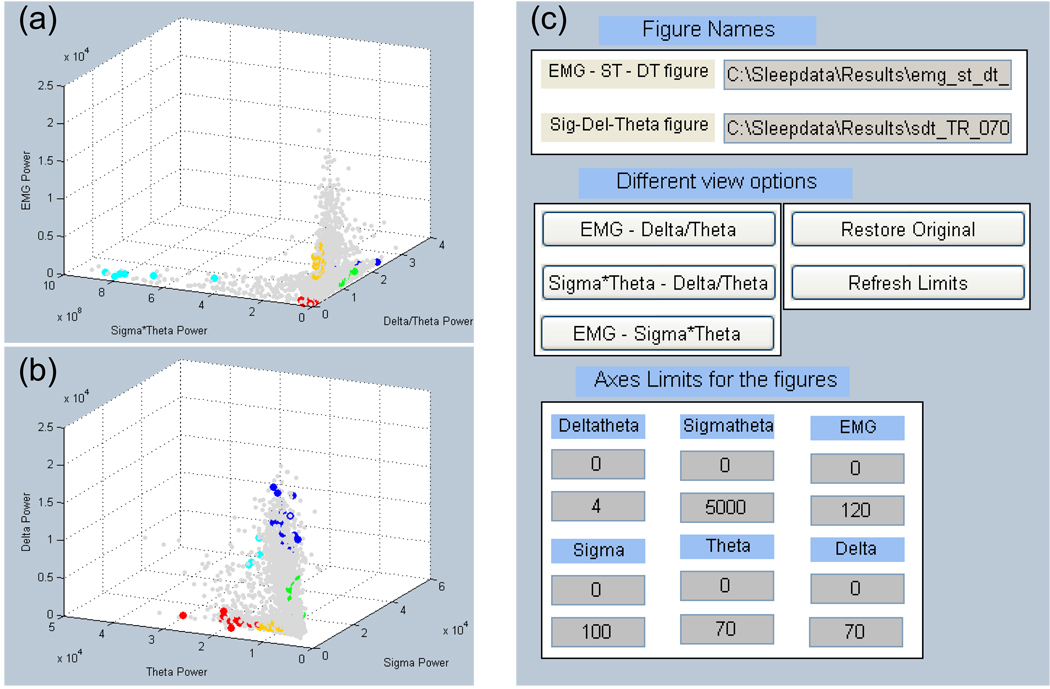
Figure 4.
User interface for determining rule-based threshold settings and visualizing auto-scored states. (a) 3D graph of states for 10 s epochs based on EMG power, sigma power*theta power, and the ratio of delta power to theta power. (b) Epochs graphed by delta, theta, and sigma powers. (c) GUI for manipulating the graphs in (a) and (b). The scored states of the epochs are distinguished using 5 distinct colors: yellow = AW, green = QW, blue = QS, turquoise = TR, and red = RE. In addition, the unscored epochs for the recording are plotted as light gray dots.

