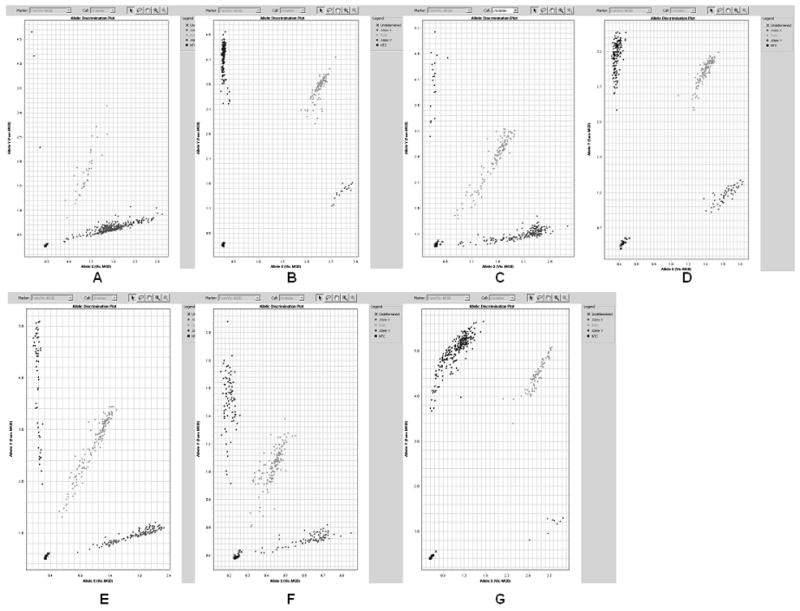
Fig. 1.

Representative Taqman plots for the seven SNPs studied. There are 3 clusters, indicating wild type of homozygotes, heterozygotes, and minor allele homozygotes. A: CYP1A1 rs4986884, B: CYP1A1 rs4646903, C: CYP1B1 rs1056836, D: CYP3A4 rs2740574, E: CYP17A1 rs743572, F: HSD17B1 rs605059, and G: ER Beta rs1256059. See Table 1 for details of each SNP.
