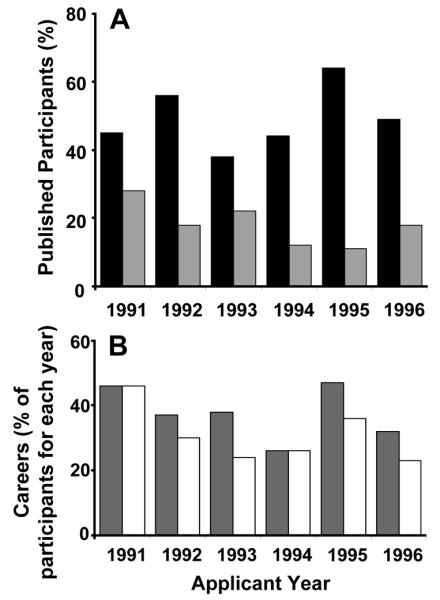
FIGURE 3.

Professional progression of MSRP participants between 1991 and 1996. With identification of greater than 94% of MSRP participants between 1991 and 1996 (n=11, 31, 42, 34, 36, and 35, respectively), (A) the percent of students who had published with their respective MSRP mentors ( ), and the students for whom one or more publications were identified (■) as of 2008. The data are normalized to total MSRP participants for each respective year. (B) The percentages of students in pediatrics (
 ) and in academic pediatrics (□) are of total MSRP participants for that year.
