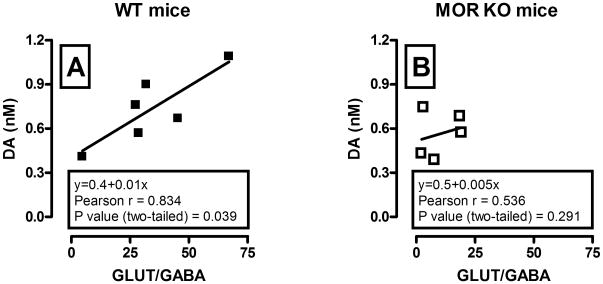
Figure 6.
Correlation analysis of the relationship between basal glutamate/GABA ratio and dialysate dopamine concentrations in the VTA of WT (A) and MOR KO (B) mice. Each graph shows regression lines, regression equation, and correlation coefficient. Significant positive correlation between basal glutamate/GABA ratio and dopamine levels was observed only in WT (n = 6, r = 0.83, P < 0.05) but not in MOR KO animals (n = 5, r = 0.53, P > 0.05).

