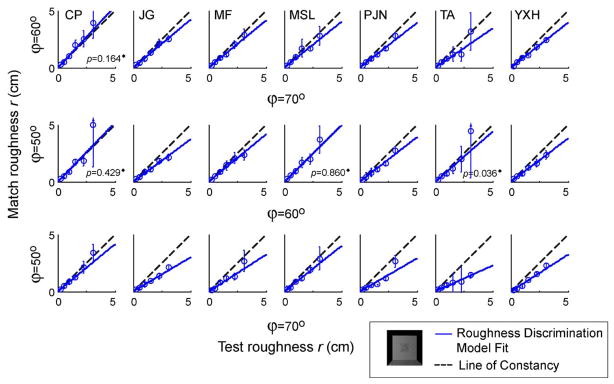
Figure 11. Results for Condition I.
PSEs are plotted for each pair of illuminant conditions for seven observers. The dashed line represents the results expected of a roughness-constant observer. The solid lines are linear fits to the data predicted by the roughness discrimination model. 17 out of 21 slopes predicted by the linear model were significantly different from 1 (at the Bonferroni-corrected α level of 0.007 per test). Error bars represent bootstrapped 95% confidence intervals. (◆ indicates a fit that is not significantly different from the line of constancy.)

