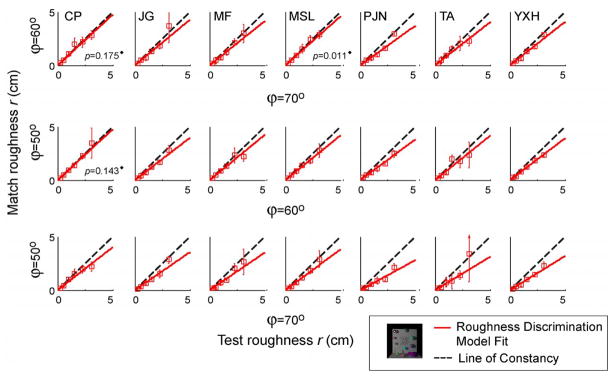
Figure 12. Results for Condition II.
Details as in Figure 11. 18 out of 21 of the slopes predicted by linear model were significantly different from 1 (at the Bonferroni-corrected α level of 0.007 per test). (◆ indicates a fit that is not significantly different from the line of constancy.)

