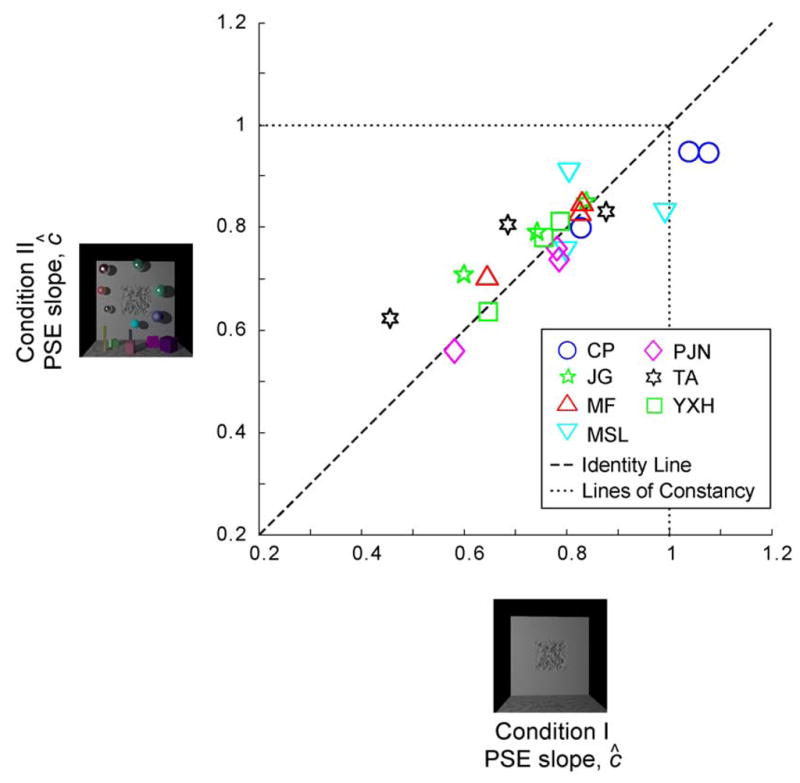
Figure 13. Results for Condition I compared to Condition II.

Estimates of the PSE slopes from Condition I are plotted versus those from Condition II for each observer. Each data point represents a comparison of all surfaces with varying roughness under two different illuminant conditions (e.g., ϕ = 70 vs. 50°) for a given observer. The dotted line represents the lines of roughness constancy along which points representing slope values of 1 would lie. The dashed line represents the identity line along which slope values for Conditions I and II would be equal to one another. Notice that almost all points lie inside the area inscribed by the lines of roughness constancy, indicating that almost all PSE slopes were less than one. Furthermore, all points lie roughly along the identity line.
