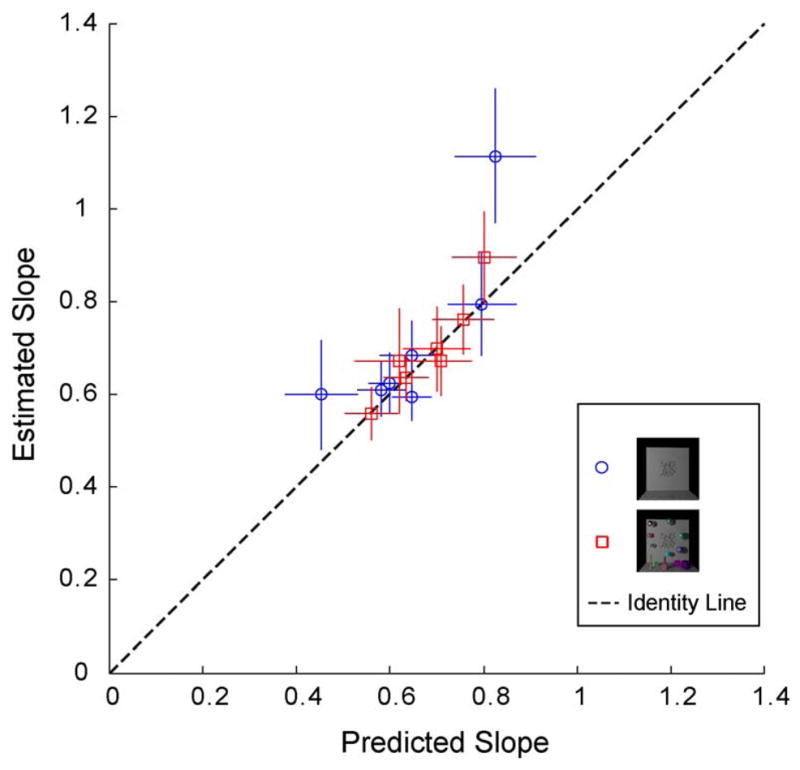
Figure 14. Results.

Estimated slopes, ĉ70°50°, compared to slopes predicted by the transitivity rule, ĉ60°50° ĉ70°60°, for all observers in Conditions I (blue) and II (red). Standard errors represent 95% confidence intervals for each bootstrapped slope. For almost all points, the slopes match the predictions (dashed line).
