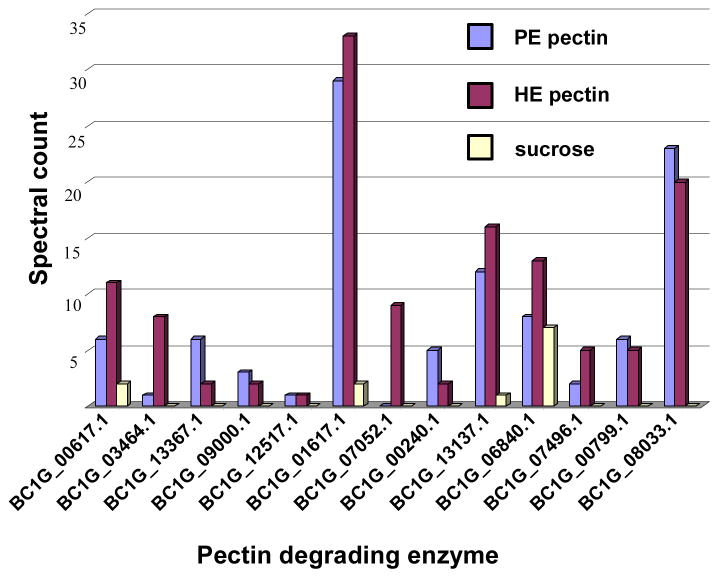
Figure 4.
Spectral count of thirteen PDEs secreted by B. cinerea grown in three different liquid cultures (sucrose, HE pectin or PE pectin as the sole carbon source). The spectral count for each PDE is the sum of the spectra identified to that PDE obtained from two replicate LC-MS/MS analyses at 1% FDR.

