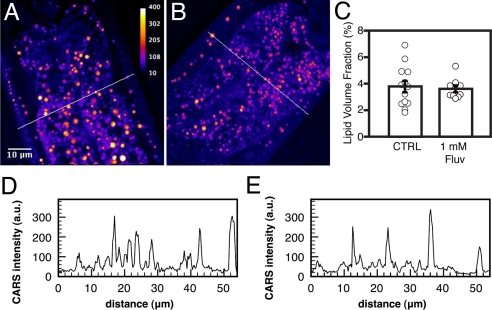
Fig. 3.
CARS imaging shows that lipid content usually does not correlate well with Nile red staining and is not affected by statin treatment. (A and B, respectively) Control worm and a fluvastatin-treated worm imaged by CARS microscopy; an intensity scale is provided in panel A. (C) Percentage of the sampled volume occupied by lipid droplets as determined by CARS microscopy on 13 individuals grown on Nile red plates (average % ± SEM: 3.79 ± 0.44), nine grown on 1 mM fluvastatin and Nile red (3.53 ± 0.30). (D and E) Intensity profiles expressed in absolute units over the area indicated by lines in panels A and B, respectively.

