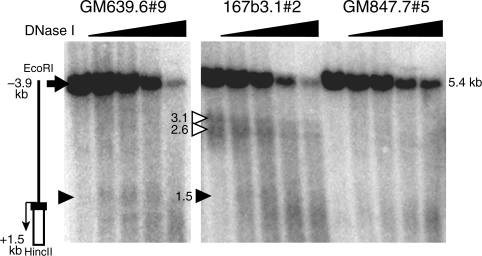
Figure 4.
DNase I sensitivity of the hTERT promoter in integrated BAC. Nuclei were treated with 0, 2, 4, 8 and 16 units/ml DNase I for at 37°C for 20 min. Genomic DNAs were isolated, digested with EcoR I and Hinc II, analyzed by Southern analysis using the Rluc sequence as the probe. A diagram of the integrated hTERT promoter is shown on the left, in which the black rectangle represents a portion of the first hTERT exon. The white rectangle shows part of the Rluc sequence, and the thin arrow shows the transcription start site (TSS) and direction. The thick arrow designates the 5.4-kb EcoR I-Hinc II full-length genomic band. The positions of restriction sites are relative to the TSS. The closed triangles denote the 1.5-kb DHS bands at the hTERT promoter. The two open triangles indicate the two additional hypersensitive bands (2.6 kb and 3.1 kb) in 167b3.1 cells, corresponding to DHSs that are 1.1-kb and 1.6-kb upstream of the hTERT promoter. The sizes of DNase I hypersensitive bands are indicated by numbers in kb.

