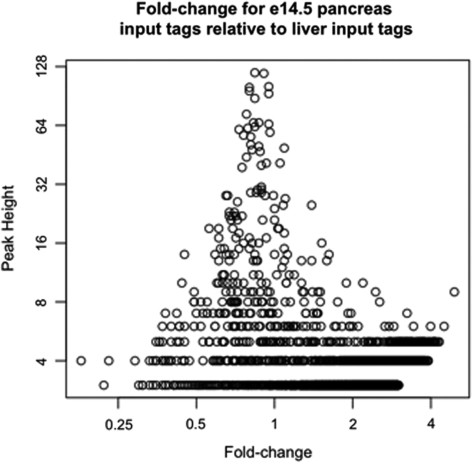
Figure 3.
Comparing input DNA from different tissues. Chromatin was isolated from e14.5 pancreas and adult mouse liver on different days, using the same fragmentation conditions. Regions were identified from e14.5 input sequence tags, and the peak height was plotted against the fold-change, which was calculated relative to liver input sequence tags. All regions have a low fold-change and are not considered significant by GLITR.

