


Abstract
We describe a quantitative method for detecting RNA alternative splicing variants that combines in situ hybridization of fluorescently labeled peptide nucleic acid (PNA) probes with confocal microscopy Förster resonance energy transfer (FRET). The use of PNA probes complementary to sequences flanking a given splice junction allows to specifically quantify, within the cell, the RNA isoform generating such splice junction by FRET measure. As a proof of concept we analyzed two alternative splicing events originating from lymphocyte antigen 6 (LY6) complex, locus G5B (LY6G5B) pre-mRNA. These are characterized by the removal of the first intron (Fully Spliced Isoform, FSI) or by retention of such intron (Intron-Retained Isoform, IRI). The use of PNA probe pairs labeled with donor (Cy3) and acceptor (Cy5) fluorophores, suitable to FRET, flanking FSI and IRI specific splice junctions specifically detected both mRNA isoforms in HeLa cells. We have observed that the method works efficiently with probes 5–11 nt apart. The data supports that this FRET-based PNA fluorescence in situ hybridization (FP–FISH) method offers a conceptually new approach for characterizing at the subcellular level not only splice variant isoform structure, location and dynamics but also potentially a wide variety of close range RNA–RNA interactions.
INTRODUCTION
Recognition of the various roles played by RNA-splicing variants within the cell is creating a demand for better methods for detecting and characterizing these RNA species in situ. Direct observation of mRNA-splicing variants in cells can provide much valuable information on the spatial distribution and compartmentalization of RNA within the cell as well as the potential significance of localization with respect to RNA processing, intranuclear turnover, protein localization and transport to the cytoplasm, complementing in vitro biochemical methods (1). Indeed, localization of transcripts is an extremely efficient way to target encoded proteins to individual subcellular compartments or to specific regions of a cell, making it an important post-transcriptional level of gene regulation (2–4). Some reports have described the in situ detection of specific splicing variants in Drosophila embryos (5), striate cortex sections (6) and microdissected eye tissue (7). An approach taken by several works involves using two kinds of fluorescent DNA oligonucleotides, each labeled with a different fluorescence molecule, having a sequence complementary to an adjacent nucleic acid sequence of the target mRNA in cells, to detect formed hybrid using Förster resonance energy transfer (FRET) (8,9). FRET is a process through which an excited fluorophore (donor) transfers its energy to a nearby light-absorbing molecule (acceptor). FRET is dependent on the proximity of both molecules, which must be within a range of 1–10 nm of each other, making this technique a unique tool to quantitatively analyze the molecular interactions with spatial and temporal resolution (10). The use of DNA oligonucleotide probes suffers two important limitations, in particular probe length and RNase H activation (11,12). One way to address these limitations is to use artificial, high-affinity analogues of DNA, such as peptide nucleic acids (PNAs). The neutral backbone of PNAs allows them to bind to DNA or RNA under low ionic strength conditions, which discourage reannealing of complementary genomic strands. Because PNA forms highly stable duplexes with RNA, the length of the hybridization probes can be decreased, and RNase H fails to recognize the unnatural structure of PNA–RNA duplex (13,14). Additional benefits of using fluorescent PNAs in situ hybridization are lower background signals, mild washing procedure and unlimited stability of the probe mixture (15). The combination of PNA probes and FRET has been used successfully for the detection of unspliced and spliced versions of RPS14A mRNA by in vitro transcription techniques (16), as well as for the direct and rapid detection and quantification of GNAS mutant alleles in fibrous dysplasia/McCune–Albright syndrome (17).
In this study we have set out a method to detect RNA-splicing variants in situ in cultured cells by exploiting the strict requirement for close proximity between donor and acceptor fluorophores detected by FRET, and combining it with FISH to be localized within the cell. Thus, suitable fluorescently labeled probes targeting sequences flanking a given splice junction will only engage in FRET in RNA species containing such splice junction but not others [for proof of concept experiments as well as characterization of FRET signals see (16)]. As a model system we chose two splicing variants of lymphocyte antigen 6 complex (LY-6), locus G5B (LY6G5B) mRNA (Figure 1). Isoform AJ315545 joins exons 1 and 2 (hereafter referred to as fully spliced isoform: FSI) whereas isoform AJ245417 retains the first intron (hereafter referred to as intron-retained isoform: IRI). Intron retention events are not exclusive to LY6G5B. Among the LY-6 major histocompatibility complex (MHC) class III region genes LY6G5B and LY6G6D showed a similar behaviour in the regulation of their alternative splicing, which involved an intron retention event (18). The intron retained lies in between exons contributing to the open reading frame and interrupts the protein just downstream the signal peptide by introducing a premature stop codon. The presence of a premature block to translation in IRI transcripts should trigger Nonsense Mediated Decay. However, both IRI as well as FSI transcripts originating from LY6G5B have been detected by RT-PCR in a wide variety of cell lines (i.e. HeLa cells) and tissues as mature, exported mRNAs (18,19). Both RNA isoforms have been also detected in the nucleus and in the cytoplasm (19). To confirm and quantitatively characterize these splicing events we designed PNA probes labeled with donor and acceptor fluorophores, such as Cy3-Cy5 FRET pairs, flanking both the spliced and unspliced sites of FSI and IRI, respectively. Below we described this new approach, which is generically applicable to quantify and characterize a wide variety of RNA interactions analyzed by in vitro techniques, as well as RNA splice variants predicted by bioinformatics and computational tools.
Figure 1.

Sequences of target sites, acceptor and donor PNA probes for FRET experiments of FSI and IRI mRNAs of LY6G5B gene. For all probes acceptor and donor fluorophores were Cy5 and Cy3, respectively. Direction of arrow denotes whether the probe was the antisense (from right to left) or the sense, control, probe (from left to right). The unlabeled control probes are indicated.
MATERIALS AND METHODS
Design of PNA probes
All fluorescent-labeled PNA probes were purchased from Panagene Inc. (Daejeon, Korea). Fluorophores used where Cy3 as FRET donor (Cy3.5 version) and Cy5 as FRET acceptor (Cy5.5 version). Design of PNA oligomer probes followed three-standard criteria: (i) probe length between 10 and 18-mer, (ii) purinic nucleotides below seven in any 10-mer stretch, (iii) no-self complementary sequences. PNA probes of 10–12-mer were designed to be complementary to sequences flanking splice junctions characteristic of splice variants AJ315545 (FSI) and AJ245417 (IRI). Target sequences, acceptor (Cy5-labeled 12-mer PNA) and donor (Cy3-labeled 10-mer PNA) probes are given in Figure 1.
Cell culture
HeLa human epithelial ovarian carcinoma cells were grown at 37°C in a humidified atmosphere of 5% CO2. Cells were maintained by regular passage in Dulbecco's modified Eagle's medium (DMEM; Gibco, Invitrogen, France). This medium was supplemented with 10% heat-inactivated fetal bovine serum (FBS), 2 mM l-glutamine, 100 U/ml penicillin, 50 U/ml streptomycin, 0.1% of sodium bicarbonate 7.5% solution and sodium pyruvate 100 mM (Gibco).
PNA fluorescence in situ hybridization (FISH)
HeLa cells were grown on 16-mm glass coverslips for 24 h in complete DMEM medium, and then washed with 1× PBS without Ca2+ or Mg2+ (Gibco). Because no protocol had been so far described for cell FISH using PNA probes, cells were initially processed according to three pre-existing FISH protocols to find the best hybridization conditions. The first protocol assayed was a modified protocol introduced by Van de Corput and colleagues (20). Briefly, cells were fixed in 4% formaldehyde, 5% acetic acid in 0.9% NaCl, and permeabilized with 70% ethanol overnight at −20°C. After permeabilization, cells were pre-treated with 0.002% pepsin in 0.01 N HCl for 4 min at 37°C, post-fixed with 3% formaldehyde, and dehydrated in a graded series of ethanol (70%, 90% and 100%), 5 min each step, at room temperature. In situ hybridizations were performed in air-dried cells by hybridizing overnight at 37°C in Hybridization Buffer (Vysis, Abbott Molecular, Pasadena, CA) containing fluorescent-labeled PNA probes (e1A-Cy5, e2D-Cy3, i1D-Cy3, e2Dsense-Cy3 or i1Dsense-Cy3) and unlabeled probes (e1A, e2D and i1D) at concentrations that ranged 1, 2, 5, 10 and 20 μM in an humidified chamber (see also Figures 1 and 2). After removing the hybridization solution with 0.1 M Tris–HCl pH 7.4, 0.15 M NaCl and 0.05% Tween 20, cells were washed twice with 2× SSC (2× Standard Saline Citrate, Gibco) at room temperature and at 37°C for three times each. Two additional FISH protocols based on the works by Bonifazi et al. (21) and Rayasam et al. (22) gave inconsistent results. For FRET experiments we used the modified Van de Corput protocol (20) with combined donor and acceptor PNA probe pairs (e1A-Cy5/e2D-Cy3, e1A-Cy5/i1D-Cy3, e1A-Cy5/e2Dsense-Cy3 and e1A-Cy5/i1Dsense-Cy3). After the final washing step, cells were mounted in antifading medium (Glycerol/PBS). All solutions were made in DEPC-treated water.
Figure 2.
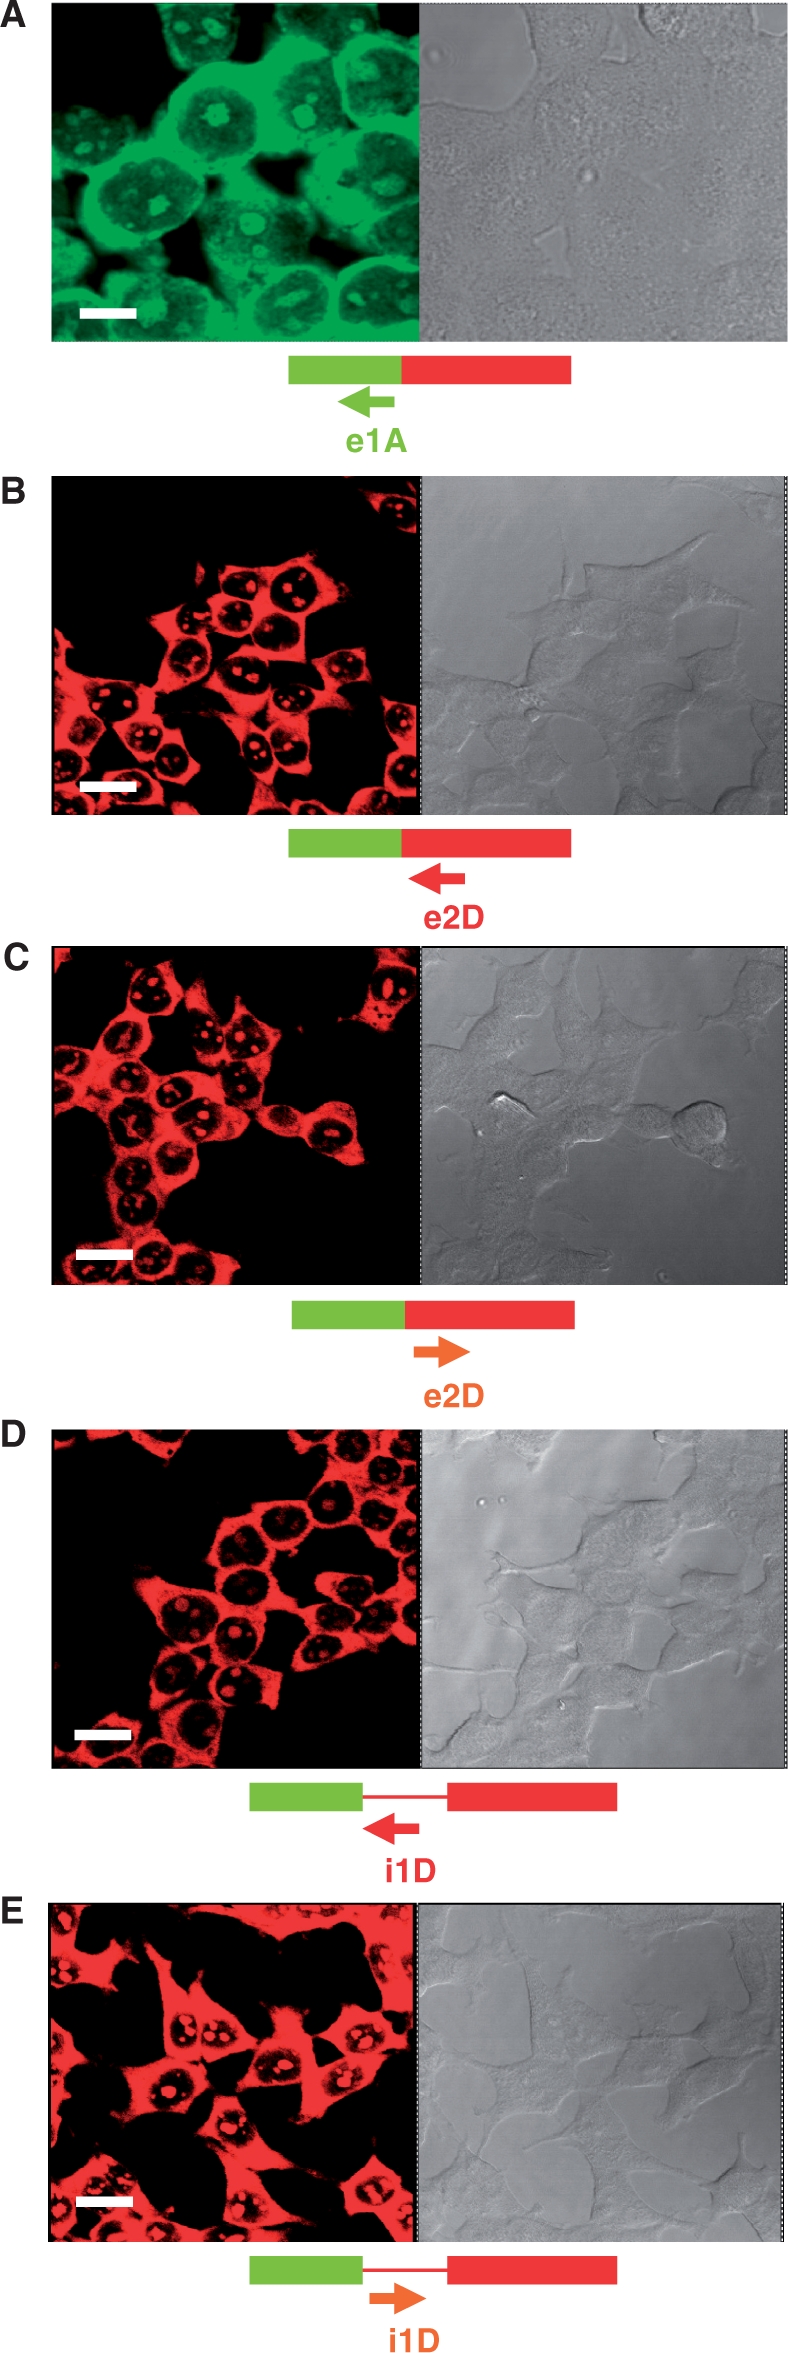
Representative confocal laser scattering microscopy images of HeLa cells hybridized with the indicated PNA probes. Images to the right were taken under phase contrast microscopy. Fluorescence signal coming from Cy5-labeled probes is shown in the green channel (A) while signal originating from Cy3-labeled probes is shown in red (B–E). Magnification bars were 10 μm (A) and 20 μm (B–E).
Combined PNA–FISH and immunofluorescence protocol
HeLa cells were grown on 16-mm glass coverslips for 24 h in complete DMEM medium, and then washed with 1× PBS without Ca2+ or Mg2+. The slides were fixed in 100% methanol at −20°C for 10 min. After removing the methanol, the slides were allowed to air dry and were stored overnight at −80°C. Cells were washed with PBS and incubated with mouse monoclonal anti-phospho-SC35 Nuclear Speckles antibody (Abcam, Cambridge, UK) for 2 h at 37°C, followed by three washes with PBS. After incubation with secondary FITC anti-mouse antibody (Sigma-Aldrich), coverslips were washed again with PBS, and then processed for PNA–FISH by hybridizing with fluorescent PNA probes (e1A-Cy5, e2D-Cy3 or i1D-Cy3) at a suitable concentration in PBS at 37°C overnight in a humidified chamber. Finally, cells were washed several times with PBS and mounted with glycerol/PBS mixture.
Imaging with confocal FRET microscopy
Confocal images were acquired with a Leica TCS-SP2 confocal microscope (Leica Microsystems, Heidelberg GmbH, Germany) at the Central Unit of Research of University of Valencia. To correct for spectral bleed-through (SBT) and for uncontrolled variations in donor–acceptor concentrations, a combination of donor, FRET and acceptor filter sets was used to isolate and maximize three specific signals: donor fluorescence, acceptor fluorescence resulting from FRET and the directly excited acceptor fluorescence, respectively. Filter sets used were as follows: the red channel (donor excitation/donor emission = 543/575 nm: Cy3), the green/blue channel (acceptor excitation/acceptor emission = 633/680 nm: Cy5) and the FRET channel (donor excitation/acceptor emission = 543/680 nm: FRET). Three different samples, containing just donor, just acceptor, and both donor and acceptor were examined with each of the three filters.
FRET image data analysis
FRET was measured using the FRET-sensitized emission Wizard of the Leica Confocal Spectrum Express 03 software package that is used for measuring the FRET efficiency. The sensitized emission technique quantifies FRET by measuring the increase in acceptor emission upon energy transfer from the donor. As described above, this method needs reference intensities (donor only and acceptor only specimens) in order to obtain calibration coefficients to correct for excitation and emission crosstalk, excitation of the acceptor through the excitation wavelength of the donor or the impact of the background signal. The software used removes both the donor and acceptor SBT problems and corrects the variation in fluorophore expression level, calculating FRET efficiency (E) in percent, based on the formula described by Wouters et al. (23): E = [BFF − (ADEBDC) − (CAECAC)]/CAE, where BFF is the intensity of fluorescence in FRET channel; ADE is the intensity in donor emission channel; CAE is the intensity in acceptor emission channel; BDC is the donor emission crosstalk ratio, and CAC is the acceptor excitation crosstalk ratio. The correction factors on the formula are (ADEBDC), the donor crosstalk correction, and (CAECAC) is the acceptor cross-excitation correction. The method involves measuring the donor (donor excitation only) and the FRET signal, followed by the detection of the acceptor (acceptor excitation only). The donor and acceptor measurements give the correction constants for elimination of the excitation and emission crosstalk. Images were sequentially recorded for each of the following three channels. First Channel A (A, ch1), that is, the excitation with excitation wavelength of donor and detection with parameter settings of donor (donor channel); Second Channel B (B, ch2), that is, the excitation with excitation wavelength of donor and detection with parameter settings of acceptor (FRET channel); Third Channel C (C, ch3), that is, the excitation with excitation wavelength of acceptor and detection with parameter settings of acceptor (acceptor channel). Once appropriate image sets were obtained, the software package generated a FRET efficiency report in which regions of interest (ROIs) were manually selected from the image. The bleed-through component in ROIs is evaluated based on the individual donor and acceptor samples, and was eliminated from the FRET data, pixel by pixel, to obtain the true (or precision) FRET efficiency signal, that is, the mean FRET pixel intensities within each ROI. FRET measurements for all ROIs selected are given as the mean ± SE from a minimum of four independent experiments. FRET values in the different conditions assayed were compared using a Student's t-test.
RESULTS
FISH in cultured cells using PNA probes requires a pepsin treatment
As a first step in the optimization of a PNA–FISH protocol to detect FSI and IRI transcripts in HeLa cells, we tested three conventional FISH protocols using several concentrations of e1A-Cy5, e2D-Cy3, i1D-Cy3 antisense and e2Dsense-Cy3 and i1Dsense-Cy3 PNA probes (1, 2, 5, 10 and 20 μM), as described in ‘Materials and Methods’ section. Based on confocal microscopy signal, the FISH protocol described by Van de Corput and colleagues (20) gave the best results at 20 μM of e1A-Cy5, and 5 μM of e2D-Cy3, e2Dsense-Cy3, i1D-Cy3 and i1Dsense-Cy3 PNA probes. Fluorescence signals allowed a clear localization of RNA isoforms in the cytoplasm and nucleus, which were also suitable to FRET analysis (Figure 2). Hybridization of the unlabeled PNA probes (e1A, e2D and i1D) were completely negative at all probe concentrations, discarding potential background noise from either cells or PNA probes (data not shown). Thus, Cy5 as well as Cy3-labeled PNA probes can hybridize to target mRNAs in situ. Other FISH protocols tested did not reveal a consistent fluorescence signal at any of the concentrations assayed (data not shown). We note that both hybridization controls e2Dsense-Cy3 and i1Dsense-Cy3 gave strong signals as well. This is probably due to their short size (10-mer), which allows them to recognize transcripts other than those originated from LY6G5B. However, hybridization signals from e2Dsense-Cy3 and i1Dsense-Cy3 are expected to be unable to engage FRET with antisense probes due to the absence of matching sequences within the LY6G5B transcripts, thus providing a convenient FRET negative control.
Ly6G5B PNA probes strongly stain the cytoplasm, but also the nucleolar subcompartment
Fluorescence signal originated from e1A-Cy5, e2D-Cy3 and i1D-Cy3 PNA probes was detected both in the cytoplasmic and nuclear cellular domains (Figure 2). We observed a patched nuclear signal resembling nuclear speckles with respect to size, shape and number. Speckles are nuclear bodies enriched in splicing and export factors (24). Alternatively, patched nuclear signal might correspond to nucleoli, which has been suggested to participate in unconventional roles, particularly the biogenesis of RNA-containing cellular machinery components other than ribosomes (25). Having optimized the concentration of PNA probes suitable for FRET analysis, we next examined the intranuclear spatial distribution of the fluorescent PNA signal in HeLa cells. Colocalization of the e1A-Cy5, e2D-Cy3 and i1D-Cy3 hybridization signals with speckles was investigated by a combination of anti-SC35 antibody staining (26) with a methanol-based FISH protocol (see ‘Materials and Methods’ section) to preserve protein epitopes (20). Because nucleoli are denser and more refractile than the nucleoplasm, co-localization of hybridization signals and nucleoli in HeLa cells was assessed by merging fluorescence and phase contrast images, which reveal nucleoli as dark nuclear bodies (27). Fluorescence originated from e1A-Cy5, e2D-Cy3 and i1D-Cy3 was accumulated in non-speckle regions (Figure 3; white arrows), detecting a complete absence of colocalization with an anti-SC35 antibody. Unexpectedly, under the transmitted light, nuclear hybridization fluorescence completely colocalized with HeLa nucleoli in all cells analyzed (Figure 3).
Figure 3.

LY6G5B PNA probes label the cytoplasm and nucleoli of HeLa cells, but not nuclear speckles. Cells were fixed and subject to FISH and immunofluorescence using fluorescent PNA probes e1A-Cy5 (A; blue), e2D-Cy3 (B; red) or i1D-Cy3 (C; red), and SC35 monoclonal antibody detected with a FITC-labeled secondary (SC35-FITC; green in A–C). Nuclear speckles (white arrows) fail to colocalize with the intranuclear hybridization signal in any field studied (shown representative examples in the merged images). Nucleoli appear as darker bodies under phase contrast transmitted light (TL; black arrows), which correspond to the locations of hybridization signals as shown in the merged images. Magnification bar, 10 μm.
Fluorescence energy transfer between exonic donor-acceptor PNA probe pairs
In these experiments Cy5 and Cy3 fluorophores served as the acceptor-donor pair for FRET. If acceptor (Cy5) and donor (Cy3) are in close proximity (<10 nm) and in appropriate relative orientation to each other, excitation of the donor molecule leads to transfer of energy to the acceptor. This energy transfer results in a decrease in emission from the donor and in increase in fluorescence at the emission wavelength of the acceptor (10,28,29). We performed FRET by imaging sensitized emission based on measuring fluorescence intensities. Detecting sensitized emission is technically the most straightforward method for measuring FRET, but it is also the most complex to analyze. Appropriate filter sets are used to isolate the specific signals from donor and acceptor to carefully correct the contamination by spectral bleed-through (SBT) of the detected FRET signal. SBT is contributed by both the donor emission that is detected in the acceptor (FRET) channel and by direct excitation of the acceptor fluorophore at the wavelength used to excite the donor (30,31). Therefore, donor-only and acceptor-only controls were included in the measurements. In fact, we used FRET-sensitized emission Wizard of the Leica Confocal Spectrum Express 03 software package, that removes both the donor and acceptor SBT problems and corrects the variation in fluorophore expression level, calculating FRET efficiency (E) in percent in the different regions of interest (ROIs) selected, as described in ‘Materials and Methods’ section.
A strong FRET signal was observed in the cytoplasm and nucleolus of HeLa cells hybridized with the FSI-specific e1A-Cy5/e2D-Cy3 probe pair (Figure 4A). After manual selection of ROIs, which included cell cytoplasms (ROI 1–9) and background (ROI 10, outside the cell), the software generated a report with FRET values information, and percent FRET efficiency for each ROI, correcting the optical crosstalk and the background effect as reference with Donor Channel A (A, ch1), with FRET Channel B (B, ch2) and Acceptor Channel C (C, ch3). Similar reports were obtained for the cytoplasms of cells, and the FRET efficiency values were used to calculate the mean FRET efficiency percentage in the cell cytoplasm (mean ± SE: 41.9 ± 1.39%, n = 88). A representative report of FRET efficiency for the negative control e1A-Cy5/e2Dsense-Cy3 probe pair is shown in Figure 4B, where the FRET efficiency percentage in manually selected cytoplasmic ROIs (ROI 1-8 in cytoplasm, white arrows) is dramatically reduced (n = 105, 5.4 ± 0.3%). FRET efficiency mean of FSI-specific e1A-Cy5/e2D-Cy3 probe pair was significantly higher than negative control probe pair e1A-Cy5/e2Dsense-Cy3 in the cytoplasm with a student's t-test (Figure 4C, P < 10−6). Values of FRET, FRET efficiency and excitation channels A, B and C for the ROIs shown in Figure 4 (also for Figures 5–7) are provided in Supplementary Data.
Figure 4.

FRET between e1A/e2D probe pair detects the LY6G5B transcript FSI in the cytoplam of HeLa cells. Representative laser scanning microscope FRET report containing donor-red, acceptor-green, FRET and FRET efficiency images (pseudocolor) from (A) positive e1A-Cy5/e2D-Cy3 and (B) negative e1A-Cy5/e2Dsense-Cy3 FRET combination in HeLa hybridized cells. The color bar represents relative degree of FRET efficiency shown in the pseudocolor images. Values of the different ROIs selected (white arrows) are shown in Supplementary Data (Figure S1A and B). Magnification bar, 10 μm. (C) Representation of mean ± SE of FRET efficiency values of cytoplasmic ROIs from e1A-Cy5/e2D-Cy3 (n = 88) and e1A-Cy5/e2Dsense-Cy3 (n = 105) in five hybridization experiments. A statistically significant difference was observed between the positive FRET pair e1A-e2D and negative e1A-e2D sense probe combination applying a Student's t-test.
Figure 5.

FRET between e1A/e2D probe pair detects the LY6G5B transcript FSI in the nucleous of HeLa cells. Representative laser scanning microscope FRET report containing donor-red, acceptor-green, FRET and FRET efficiency images (pseudocolor) from (A) positive e1A-Cy5/e2D-Cy3 and (B) negative e1A-Cy5/e2Dsense-Cy3 FRET combination in HeLa cells. The color bar represents relative degree of FRET efficiency shown in the pseudocolor images. Values of the different ROIs selected (white arrows) are shown in Supplementary Data (Figure S1C and D). Magnification bar, 10 μm. (C) Representation of mean ± SE of FRET efficiency values of nucleolar ROIs from e1A-Cy5/e2D-Cy3 (n = 27) and e1A-Cy5/e2Dsense-Cy3 (n = 39) in four hybridization experiments. A statistically significant difference was observed between the positive FRET pair e1A/e2D and negative e1A-e2D sense probe combination applying a Student's t-test.
Figure 6.

FRET between e1A/i1D probe pair detects the LY6G5B transcript IRI in the cytoplasm of HeLa cells. Representative laser scanning microscope FRET report containing donor-red, acceptor-green, FRET and FRET efficiency images (pseudocolor) from (A) positive e1A-Cy5/i1D-Cy3 and (B) negative e1A-Cy5/i1Dsense-Cy3 FRET combination in HeLa cells. The color bar represents relative degree of FRET efficiency shown in the pseudocolor images. Values of the different ROIs selected (white arrows) are shown in Supplementary Data (Figure S2A and B). Magnification bar, 10 μm. (C) Representation of mean ± SE of FRET efficiency values of cytoplasmic ROIs from e1A-Cy5/i1D-Cy3 (n = 108) and e1A-Cy5/i1Dsense-Cy3 (n = 71) in four hybridization experiments. A statistically significant difference was observed between the positive FRET pair e1A-i1D and negative e1A-i1D sense probe combination applying a Student's t-test.
Figure 7.

FRET between e1A/i1D probe pair detects the LY6G5B transcript IRI in the nucleolus of HeLa cells. Representative laser scanning microscope FRET report containing donor-red, acceptor-green, FRET and FRET efficiency images (pseudocolor) from (A) positive e1A-Cy5/i1D-Cy3 and (B) negative e1A-Cy5/i1Dsense-Cy3 FRET combination in HeLa cells. The color bar represents relative degree of FRET efficiency shown in the pseudocolor images. Values of the different ROIs selected (white arrows) are shown in Supplementary Data (Figure S2C and D). Magnification bar, 10 μm. (C) Representation of mean ± SE of FRET efficiency values of nucleolar ROIs from e1A-Cy5/i1D-Cy3 (n = 41) and e1A-Cy5/i1Dsense-Cy3 (n = 39) in four hybridization experiments. A Student's t-test reveals statistically significant difference between mean FRET efficiency values from e1A/i1D and e1A/i1Dsense hybridization conditions.
A similar FRET was detected between FSI-specific donor acceptor probe pairs (e1A-Cy5/e2D-Cy3) in nucleolar ROIs (Figure 5A). After manual selection of ROIs (ROI 1–8 in nucleoli, white arrows), the software generated a report with FRET efficiency values. Nucleolar reports of e1A-Cy5/e2D-Cy3 FRET were obtained, and the mean ± SE FRET efficiency values were 73.7 ± 5.45%, n = 27. In contrast, FRET efficiency for the negative probe pair e1A-Cy5/e2Dsense-Cy3 was significantly lower in nucleolar regions (n = 39, 0.6 ± 0.09%) applying a Student's t-test (Figure 5, P < 10−4). Taken together these results indicate that FSI RNA locates to the nucleolus thus suggesting either an unconventional role for nucleoli in LY6G5B pre-mRNA processing or a role for FSI transcripts in a nucleolar function.
Isoform-specific fluorescence energy transfer
We next performed a similar FRET analysis in HeLa cells using the IRI-specific e1A-Cy5/i1D-Cy3 probe pair. In Figure 6A, we show a representative FRET images report of manually selected cytoplasmic ROIs (ROI 1–8 in cytoplasm and ROI 9 outside the cell, white arrows). Equivalent e1A-Cy5/i1D-Cy3 FRET reports were obtained. The percentage FRET efficiency mean ± SE of all ROIs selected was 28.3 ± 0.78%, n = 108, in contrast to the negative FRET probe pair e1A-Cy5/i1Dsense-Cy3 in cytoplasmic regions (0.49 ± 0.21%, n = 71), which is shown in a FRET image report in Figure 6B (ROI 1–7 in cytoplasm and ROI 8 outside the cell, white arrows). Mean FRET efficiency values were significantly different in a Student's t-test (P < 10−6).
In the analysis of the nucleolar signal, the mean of FRET efficiency for the e1A-Cy5/i1D-Cy3 probe pair was 17 ± 0.75% (n = 41), in contrast to 0.7 ± 0.37% (n = 39) of nucleolar ROIs from HeLa cells hybridized with the negative control e1A-Cy5/i1Dsense-Cy3 probe combination. A representative laser scanning microscope FRET report derived from the selection of nucleolar regions of e1A-Cy5/i1D-Cy3 and e1A-Cy5/i1Dsense-Cy3 hybridizations are shown in Figure 7A (ROI 1–6 in nucleoli, white arrows) and Figure 7B (ROI 1–14, white arrows), respectively. FRET efficiency differences were significant in a Student's t-test (Figure 7C, P < 10−5).
FRET efficiency values critically depend on donor and acceptor concentration thus providing an estimate of target sequence concentration in different cellular compartments. Average FRET efficiency for FSI-specific probe pair was significantly higher in the nucleolus (73.7%) than in the cytoplasm (41.9%; P < 0.05) thus indicating that the concentration of FSI was higher in the nucleolus than in the cytoplasm. Contrarily, FRET efficiency for IRI-specific probe pair was significantly lower in the nucleolus (17%) than in the cytoplasm (28.3%; P < 0.001) thus pointing at a preferential accumulation of IRI in the cytoplasm. However, because FRET efficiency also depends on distance between donor/acceptor fluorophore pairs, which is different in FSI and IRI probe pairs, comparisons between FSI and IRI expression levels in the same cellular compartment, for example the cytoplasm, are not possible.
DISCUSSION
We describe a FRET-based PNA FISH (FP–FISH) as a novel in situ detection method for the characterization of mRNA-splicing variants in cultured cells. The method basically involves using two fluorescently labeled PNA probes complementary to sequences flanking a given splice junction, which specifically detects mRNA species in which such two sequences are close together by engaging appropriate donor/acceptor fluorophore pairs in FRET. This method provides sensitive and valuable information on the spatial distribution and compartmentalization of specific RNA species, and the possible significance of this localization in RNA processing, intranuclear turnover and transport to the cytoplasm. FP–FISH has three main advantages: (i) the high efficiency of PNA probes in FISH by improving the binding specificity, background signals and the unlimited stability of the probe mixture; (ii) the use of suitable PNA pair fluorophores to increase FRET efficiency in the hybridized cell samples; and (iii) the analysis by FRET sensitized emission under a software guidance optimizing the image and the measurements of the FRET share being the system easy for the operators to handle. The method, nevertheless, is intrinsically limited to the detection of splice variants one at a time, as it relies on the hybridization of probe pairs to unique splice junction sequences.
To determine the presence and abundance of an mRNA in a tissue or cell sample, a variety of techniques are available. Northern hybridization, RNA-protection assays, and the more sensitive RT–PCR are most frequently used for this purpose. With appropriate calibration, these techniques also allow relative and absolute quantitation of mRNA abundance, and spatial and temporal differences in mRNA expression can likewise be determined. However, they do have the basic limitation that only average mRNA abundance of a tissue or cell sample can be determined. In situ hybridization (ISH) has the ability to visualize mRNA sequences at the (sub-)cellular level with high spatial and temporal resolution, distance range, and sensitivity, in a broader range of biological applications (32). Therefore, this method can better quantify the ‘true’ expression level of different mRNA species in cells and is an important tool for gene expression studies (33,34). ISH originally utilized probes in the form of radioactively labeled rRNA, visualized by autoradiography (35). Subsequently, various non-isotopic probe labels have also been used, usually detected with immunoenzymatic methods (36) or fluorescent in situ hybridization (FISH) (37). In order to generate sufficient signal, non-isotopic ISH methods usually use long probes or multiple probe cocktails for binding of sufficient number of label molecules to each target. However, long probes, as well as being not well suited for the discrimination of minor sequence variations, also add a problem since affinity and specificity for nucleic acid probes usually are inversely correlated (38). The use of short synthetic DNA oligomers as well as biosynthesizing short RNA probes modified with fluorescent labels have limitations in detecting and probing the structure and function of biological RNAs. For example, DNA-based probes have relatively low affinity for complementary RNA, so it requires that either long DNA probes be used or effective target sites be limited to unstructured regions of the RNA (12). Also, the problems and cost of chemically synthesized RNA, as well as limitations on biosynthesizing RNA site-specifically modified with fluorophores (39–41), hinder progress in this area. One possibility to address these hybridization probes limitations is to use unnatural, high-affinity analogues of DNA. In the present study, we used artificial nucleic acids, such as PNA–oligonucleotides, that typically hybridize to complementary DNA and RNA targets with high affinity, yielding base-paired duplexes with high thermal stabilities (13,42). As a first step in confirming that the PNA–FISH assay did detect FSI and IRI mRNA splice sites sequences in HeLa cells, we tested different concentrations of e1A-Cy5, e2D-Cy3, i1D-Cy3 antisense PNA probes and, e2Dsense-Cy3 and i1Dsense-Cy3 under three different FISH protocols. Clear localization of mRNA molecules in the cytoplasm and nucleus was only found with a FISH protocol that included a mild pepsin treatment step while alternative FISH protocols gave unconsistent hybridization signals or no signal at all.
FRET is one of the most useful and widely applied tool in use today to measure distances on the molecular scale in cells (43,44). The majority of FRET studies had been applied to identify and spatially localize sites of direct interaction between molecules, specially the detection of direct protein–protein interactions, but little is known about the use of this technique to detect and characterize RNA species interaction. Here we show the usefulness of FRET to quantitavely analyze splicing events (FSI and IRI) of a specific gene, LY6G5B, in cell in culture. We show a strong FRET signal in the cytoplasm and nucleoli of HeLa cells hybridized with positive FRET–PNA probe pairs detecting FSI and IRI. Consistently, negative FRET–PNA probe pairs e1A-Cy5/e2Dsense-Cy3 and e1A-Cy5/i1Dsense-Cy3 showed a statistically significant decrease in FRET efficiency both in the cytoplasm and nucleoli of HeLa cells. FRET efficiency values can be used to provide an estimate of target RNA concentration in a given cellular location. For example, we detect higher FRET efficiency for FSI probe pair in the nucleolus than in the cytoplasm (Figures 4 and 5), thus suggesting that FSI transcripts preferentially accumulated in the nucleolus versus the cytoplasm. However, we note that a comparison of relative levels of expression of FSI versus IRI in the cytoplasm or nucleolus is not possible as FRET efficiency values are also influenced by the distance that separates donor and acceptor fluorophores in FSI and IRI probe pairs. Indeed, as the number of nucleotides separating two fluorophores decreased from 11 (e1A-Cy5/i1D-Cy3) to 5 (e1A-Cy5/e2D-Cy3), changes in fluorescence FRET spectra became larger, from cytoplasmic 28.3% and nucleolar 17% FRET efficiency to cytoplasmic 41.9% and nucleolar 73.7%, respectively, consistent with isoform specific FRET. Within a range from 4–14 nt, the distances between two fluorophores estimated from FRET efficiency were well correlated with the expected distances between two fluorophore-conjugated nucleotides (9). Our results show that FRET occurred quantitatively in response to the number of nucleotides separating the donor and acceptor on the double-strand PNA–RNA hybrids formed, suggesting that under the PNA design rules, the selection of PNA probe pairs suitable for FRET analysis ought to be 4–14 nt apart for best results.
We note that FP–FRET is not confined to detecting nearby sequences within a single molecule, but has the potential to be used as a molecular ruler to determine intermolecular distances, either between two RNA molecules or an RNA molecule and a protein. For example, detection of fluorescence energy transfer between a donor PNA probe against a given sequence in molecule 1 and acceptor PNA probe against a given sequence in molecule 2, would place both molecules a maximum of 10 nm apart. These evolutions of the FP–FRET application we describe would help delineate RNA or RNA–protein conformational changes in large macromolecular complexes, for instance the working spliceosome, for which few structural details are known so far, and whose 3D structure has not been obtained. Also, this new approach could be generically applicable to quantify and characterize a wide variety of RNA interactions analyzed by in vitro techniques, and potential trans-splicing variants predicted by bioinformatic and computational tools. So, this method could fulfill the need for efficient methods allowing the detection and characterization of RNA–RNA and RNA–protein interactions, such as snRNAs (45), snoRNAs with their targets (46), and micro-RNAs from the RNAi pathway with their target mRNA(s) (47). Through technical improvements, we believe that FP–FISH could be suitable to automatization, as similarly seen in cytogenetic imaging through commercially available imaging platforms (48–51).
A combination of FISH and immunofluorescence methods was used to discard co-localization of intranuclear fluorescent PNA signal and nuclear speckles in HeLa cells. Instead, under transmitted light, FSI and IRI isoforms accumulated in patches that perfectly colocalized with HeLa nucleoli. This was surprising as nuclear speckles are typically associated with pre-mRNA splicing, mature mRNA storage, and export control (26,52), whereas nucleoli are physical compartments where ribosome biogenesis takes place. Nevertheless, the nucleoli have been involved in a number of unconventional cellular processes, such as mRNA export or surveillance. For example, spliced c-myc RNA localized to the nucleolus in mammalian cells (53). The nucleolus in mRNA transport-defective yeast mutants has been shown to be disrupted and fragmented. Furthermore, heat shock or mutation of nucleolar proteins such as pol I or Mtr3p, also implicated in mRNA transport, result in accumulation of polyA + RNA in the nucleolus of yeast (54,55). Evidence from Schizosaccharomyces pombe indicated that a subset of polyA + RNA associates transiently with the nucleolus during export; in transport-defective mutants, an intron-containing transcript accumulated in the nucleolus, whereas transcripts from the intronless cDNA did not accumulate (56). One work using a GFP-based reporter system in living yeast cells showed that mRNA processing factors were required for nuclear export of mRNAs, demonstrating a clear coupling between mRNA processing and export. Moreover, mRNAs containing a particular 3′-untranslated region sequence from the ASH1 transcript accumulated in the nucleolus (57). Given the clear nucleolar localization of LY6G5B isoforms as well as the examples just mentioned, we suggest an unconventional role for the nucleolus in FSI and IRI isoform metabolism including export control, RNA surveillance and/or an as yet unknown function.
In summary, FP–FISH provides a robust in situ technology to quantitatively characterize different mRNA splice variants with spatial and temporal resolution within a cell. The assay might also be adapted to the analysis of RNA–RNA and RNA–protein interactions and is therefore expected to resolve and confirm predicted macromolecular interactions involving RNA, and to find broad application in basic cell biology and molecular pathology research.
SUPPLEMENTARY DATA
Supplementary Data are available at NAR Online.
FUNDING
Genoma España Foundation [Acción Especial sobre Genómica de Enfermedades Raras ‘Cetegen’]. Funding for open access charge: Genoma España Foundation.
Conflict of interest statement. None declared.
Supplementary Material
ACKNOWLEDGEMENTS
The authors thank Alberto Hernandez and Sonia Priego for their invaluable help with the confocal microscopy and FRET analysis, as well as Francisco García for his support with statistical analysis.
Footnotes
Present address: Manuel Perez-Alonso, Department of Genetics, University of Valencia, Dr. Moliner, 50, E-46100 Burjassot, Spain
REFERENCES
- 1.Chusainow J, Ajuh PM, Trinkle-Mulcahy L, Sleeman JE, Ellenberg J, Lamond AI. FRET analyses of the U2AF complex localize the U2AF35/U2AF65 interaction in vivo and reveal a novel self-interaction of U2AF35. RNA. 2005;11:1201–1214. doi: 10.1261/rna.7277705. [DOI] [PMC free article] [PubMed] [Google Scholar]
- 2.Kloc A, Zearfoss NR, Etkin LD. Mechanisms of subcellular mRNA localization. Cell. 2002;108:533–544. doi: 10.1016/s0092-8674(02)00651-7. [DOI] [PubMed] [Google Scholar]
- 3.Adereth Y, Dammai V, Kose N, Li R, Hsu T. RNA-dependent integrin alpha3 protein localization regulated by the Muscleblind-like protein MLP1. Nat. Cell Biol. 2005;7:1240–1247. doi: 10.1038/ncb1335. [DOI] [PMC free article] [PubMed] [Google Scholar]
- 4.Lécuyer E, Yoshida H, Parthasarathy N, Alm C, Babak T, Cerovina T, Hughes TR, Tomancak P, Krause HM. Global analysis of mRNA localization reveals a prominent role in organizing cellular architecture and function. Cell. 2007;131:174–187. doi: 10.1016/j.cell.2007.08.003. [DOI] [PubMed] [Google Scholar]
- 5.Artero RD, Akam M, Pérez-Alonso M. Oligonucleotide probes detect splicing variants in situ in Drosophila embryos. Nucleic Acids Res. 1992;20:5687–5690. doi: 10.1093/nar/20.21.5687. [DOI] [PMC free article] [PubMed] [Google Scholar]
- 6.Yin ZQ, Deng ZM, Crewther SG, Crewther DP. Altered expression of alternatively spliced isoforms of the mRNA NMDAR1 receptor in the visual cortex of strabismic cats. Mol. Vis. 2001;7:271–276. [PubMed] [Google Scholar]
- 7.Ledee DR, Chen J, Tonelli LH, Takase H, Gery I, Zelenka PS. Differential expression of splice variants of chemokine CCL27 mRNA in lens, cornea, and retina of the normal mouse eye. Mol. Vis. 2004;10:663–667. [PubMed] [Google Scholar]
- 8.Tsuji A, Sato Y, Hirano M, Suga T, Koshimoto H, Taguchi T, Ohsuka S. Development of a time-resolved fluorometric method for observing hybridization in living cells using fluorescence resonance energy transfer. Biophys. J. 2001;81:501–515. doi: 10.1016/S0006-3495(01)75717-7. [DOI] [PMC free article] [PubMed] [Google Scholar]
- 9.Tsuji A, Koshimoto H, Sato Y, Hirano M, Sei-Iida Y, Kondo S, Ishibashi K. Direct observation of specific messenger RNA in a single living cell under a fluorescence microscope. Biophys. J. 2000;78:3260–3274. doi: 10.1016/S0006-3495(00)76862-7. [DOI] [PMC free article] [PubMed] [Google Scholar]
- 10.Megías D, Marrero R, Martínez Del Peso B, García MA, Bravo-Cordero JJ, García-Grande A, Santos A, Montoya MC. Novel lambda FRET spectral confocal microscopy imaging method. Microsc. Res. Tech. 2009;72:1–11. doi: 10.1002/jemt.20633. [DOI] [PubMed] [Google Scholar]
- 11.Dorywalska M, Blanchard SC, Gonzalez RL, Kim HD, Chu S, Puglisi JD. Site-specific labeling of the ribosome for single-molecule spectroscopy. Nucleic Acids Res. 2005;33:182–189. doi: 10.1093/nar/gki151. [DOI] [PMC free article] [PubMed] [Google Scholar]
- 12.Smith GJ, Sosnick TR, Scherer NF, Pan T. Efficient fluorescence labelling of a large RNA through oligonucleotide hybridization. RNA. 2005;11:234–239. doi: 10.1261/rna.7180305. [DOI] [PMC free article] [PubMed] [Google Scholar]
- 13.Pellestor F, Paulasova P. The peptide nucleic acids (PNAs), powerful tools for molecular genetics and cytogenetics. Eur. J. Hum. Genet. 2004;12:694–700. doi: 10.1038/sj.ejhg.5201226. [DOI] [PubMed] [Google Scholar]
- 14.Ray A, Nordén B. Peptide nucleic acid (PNA): its medical and biotechnical applications and promise for the future. FASEB J. 2000;14:1041–1060. doi: 10.1096/fasebj.14.9.1041. [DOI] [PubMed] [Google Scholar]
- 15.Williams B, Stender H, Coull JM. PNA fluorescent in situ hybridization for rapid microbiology and cytogenetic analysis. Methods Mol. Biol. 2002;208:181–193. doi: 10.1385/1-59259-290-2:181. [DOI] [PubMed] [Google Scholar]
- 16.Robertson KL, Yu L, Armitage BA, Lopez AJ, Peteanu LA. Fluorescent PNA probes as hybridization labels for biological RNA. Biochemistry. 2006;45:6066–6074. doi: 10.1021/bi052050s. [DOI] [PubMed] [Google Scholar]
- 17.Karadag A, Riminucci M, Bianco P, Cherman N, Kuznetsov SA, Nguyen N, Collins MT, Robey PG, Fisher LW. A novel technique based on a PNA hybridization probe and FRET principle for quantification of mutant genotype in fibrous dysplasia/McCune-Albright syndrome. Nucleic Acids Res. 2004;32:e63. doi: 10.1093/nar/gnh059. [DOI] [PMC free article] [PubMed] [Google Scholar]
- 18.Mallya M, Campbell RD, Aguado B. Transcriptional analysis of a novel cluster of LY-6 family members in the human and mouse major histocompatibility complex: five genes with many splice forms. Genomics. 2002;80:113–123. doi: 10.1006/geno.2002.6794. [DOI] [PubMed] [Google Scholar]
- 19.Calvanese V, Mallya M, Campbell RD, Aguado B. Regulation of expression of two LY-6 family genes by intron retention and transcription induced chimerism. BMC Mol. Biol. 2008;9:81. doi: 10.1186/1471-2199-9-81. [DOI] [PMC free article] [PubMed] [Google Scholar]
- 20.van de Corput MP, Grosveld FG. Fluorescence in situ hybridization analysis of transcript dynamics in cells. Methods. 2001;25:111–118. doi: 10.1006/meth.2001.1220. [DOI] [PubMed] [Google Scholar]
- 21.Bonifazi E, Gullotta F, Vallo L, Iraci R, Nardone AM, Brunetti E, Botta A, Novelli G. Use of RNA fluorescence in situ hybridization in the prenatal molecular diagnosis of myotonic dystrophy type I. Clin. Chem. 2006;52:319–322. doi: 10.1373/clinchem.2005.056283. [DOI] [PubMed] [Google Scholar]
- 22.Rayasam GV, Elbi C, Walker DA, Wolford R, Fletcher TM, Edwards DP, Hager GL. Ligand-specific dynamics of the progesterone receptor in living cells and during chromatin remodeling in vitro. Mol. Cell Biol. 2005;25:2406–2418. doi: 10.1128/MCB.25.6.2406-2418.2005. [DOI] [PMC free article] [PubMed] [Google Scholar]
- 23.Wouters FS, Verveer PJ, Bastiaens PI. Imaging biochemistry inside cells. Trends Cell Biol. 2001;11:203–211. doi: 10.1016/s0962-8924(01)01982-1. [DOI] [PubMed] [Google Scholar]
- 24.Rodrigues JP, Rode M, Gatfield D, Blencowe BJ, Carmo-Fonseca M, Izaurralde E. REF proteins mediate the export of spliced and unspliced mRNAs from the nucleus. Proc. Natl Acad. Sci. USA. 2001;98:1030–1035. doi: 10.1073/pnas.031586198. [DOI] [PMC free article] [PubMed] [Google Scholar]
- 25.Raska I, Shaw PJ, Cmarko D. New insights into nucleolar architecture and activity. Int. Rev. Cytol. 2006;255:177–235. doi: 10.1016/S0074-7696(06)55004-1. [DOI] [PubMed] [Google Scholar]
- 26.Schmidt U, Richter K, Berger AB, Lichter P. In vivo BiFC analysis of Y14 and NXF1 mRNA export complexes: preferential localization within and around SC35 domains. J. Cell Biol. 2006;172:373–381. doi: 10.1083/jcb.200503061. [DOI] [PMC free article] [PubMed] [Google Scholar]
- 27.Leung AK, Andersen JS, Mann M, Lamond AI. Bioinformatic analysis of the nucleolus. Biochem. J. 2003;376:553–569. doi: 10.1042/BJ20031169. [DOI] [PMC free article] [PubMed] [Google Scholar]
- 28.Leuba SH, Anand SP, Harp JM, Khan SA. Expedient placement of two fluorescent dyes for investigating dynamic DNA protein interactions in real time. Chromosome Res. 2008;16:451–467. doi: 10.1007/s10577-008-1235-5. [DOI] [PMC free article] [PubMed] [Google Scholar]
- 29.Voss TC, Demarco IA, Day RN. Quantitative imaging of protein interactions in the cell nucleus. Biotechniques. 2005;38:413–424. doi: 10.2144/05383RV01. [DOI] [PMC free article] [PubMed] [Google Scholar]
- 30.Elder AD, Domin A, Kaminski Schierle GS, Lindon C, Pines J, Esposito A, Kaminski CF. A quantitative protocol for dynamic measurements of protein interactions by Förster resonance energy transfer-sensitized fluorescence emission. J. R. Soc. Interface. 2009;6:S59–S81. [Google Scholar]
- 31.Sekar RB, Periasamy A. Fluorescence resonance energy transfer (FRET) microscopy imaging of live cell protein localizations. J. Cell Biol. 2003;160:629–633. doi: 10.1083/jcb.200210140. [DOI] [PMC free article] [PubMed] [Google Scholar]
- 32.van de Corput MP, Dirks RW, van Gijlswijk RP, van Binnendijk E, Hattinger CM, de Paus RA, Landegent JE, Raap AK. Sensitive mRNA detection by fluorescence in situ hybridization using horseradish peroxidase-labelled oligodeoxynucleotides and tyramide signal amplification. J. Histochem. Cytochem. 1998;46:1249–1259. doi: 10.1177/002215549804601105. [DOI] [PubMed] [Google Scholar]
- 33.Lee CK, Sunkin SM, Kuan C, Thompson CL, Pathak S, Ng L, Lau C, Fischer S, Mortrud M, Slaughterbeck C, et al. Quantitative methods for genome-scale analysis of in situ hybridization and correlation with microarray data. Genome Biol. 2008;9:R23. doi: 10.1186/gb-2008-9-1-r23. [DOI] [PMC free article] [PubMed] [Google Scholar]
- 34.Yaylaoglu MB, Agbemafle BM, Oesterreicher TJ, Finegold MJ, Thaller C, Henning SJ. Diverse patterns of cell-specific gene expression in response to glucocorticoid in the developing small intestine. Am. J. Physiol. Gastrointest. Liver Physiol. 2006;291:G1041–G1050. doi: 10.1152/ajpgi.00139.2006. [DOI] [PubMed] [Google Scholar]
- 35.Gall JG, Pardue ML. Formation and detection of RNA-DNA hybrid molecules in cytological preparations. Proc. Natl Acad. Sci. USA. 1969;63:378–383. doi: 10.1073/pnas.63.2.378. [DOI] [PMC free article] [PubMed] [Google Scholar]
- 36.Langer-Safer PR, Levine M, Ward DC. Immunological method for mapping genes on Drosophila polytene chromosomes. Proc. Natl Acad. Sci. USA. 1982;79:4381–4385. doi: 10.1073/pnas.79.14.4381. [DOI] [PMC free article] [PubMed] [Google Scholar]
- 37.Bauman JG, Wiegant J, van Duijn P. Cytochemical hybridization with fluorochrome-labelled RNA. II. Applications. J. Histochem. Cytochem. 1981;29:238–246. doi: 10.1177/29.2.6166654. [DOI] [PubMed] [Google Scholar]
- 38.Stougaard M, Lohmann JS, Zajac M, Hamilton-Dutoit S, Koch J. In situ detection of non-polyadenylated RNA molecules using Turtle Probes and target primed rolling circle PRINS. BMC Biotechnol. 2007;7:69. doi: 10.1186/1472-6750-7-69. [DOI] [PMC free article] [PubMed] [Google Scholar]
- 39.Qin PZ, Pyle AM. Site-specific labeling of RNA with fluorophores and other structural probes. Methods. 1999;18:60–70. doi: 10.1006/meth.1999.0757. [DOI] [PubMed] [Google Scholar]
- 40.Li N, Yu C, Huang F. Novel cyanine-AMP conjugates for efficient 5′ RNA fluorescent labelling by one-step transcription and replacement of [gamma-32P]ATP in RNA structural investigation. Nucleic Acids Res. 2005;33:e37. doi: 10.1093/nar/gni036. [DOI] [PMC free article] [PubMed] [Google Scholar]
- 41.Moore MJ, Query CC. Joining of RNAs by splinted ligation. Methods Enzymol. 2000;317:109–123. doi: 10.1016/s0076-6879(00)17009-0. [DOI] [PubMed] [Google Scholar]
- 42.Bonvicini F, Filippone C, Manaresi E, Gentilomi GA, Zerbini M, Musiani M, Gallinella G. Peptide nucleic acid-based in situ hybridization assay for detection of parvovirus B19 nucleic acids. Clin. Chem. 2006;52:973–978. doi: 10.1373/clinchem.2005.064741. [DOI] [PubMed] [Google Scholar]
- 43.Murata S, Herman P, Mochizuki K, Nakazawa T, Kondo T, Nakamura N, Lakowicz JR, Katoh R. Spatial distribution analysis of AT- and GC-rich regions in nuclei using corrected fluorescence resonance energy transfer. J. Histochem. Cytochem. 2003;51:951–958. doi: 10.1177/002215540305100710. [DOI] [PubMed] [Google Scholar]
- 44.Murata S, Herman P, Iwashina M, Mochizuki K, Nakazawa T, Kondo T, Nakamura N, Lakowicz JR, Katoh R. Application of microscopic Forster resonance energy transfer to cytological diagnosis of the thyroid tumors. J. Biomed. Opt. 2005;10 doi: 10.1117/1.1924667. 034008. [DOI] [PMC free article] [PubMed] [Google Scholar]
- 45.Forné T, Labourier E, Antoine E, Rossi F, Gallouzi I, Cathala G, Tazi J, Brunel C. Structural features of U6 snRNA and dynamic interactions with other spliceosomal components leading to pre-mRNA splicing. Biochimie. 1996;78:436–442. doi: 10.1016/0300-9084(96)84750-x. [DOI] [PubMed] [Google Scholar]
- 46.Bachellerie JP, Cavaillé J, Hüttenhofer A. The expanding snoRNA world. Biochimie. 2002;84:775–790. doi: 10.1016/s0300-9084(02)01402-5. [DOI] [PubMed] [Google Scholar]
- 47.Hartmann C, Corre-Menguy F, Boualem A, Jovanovic M, Lelandais-Brière C. MicroRNAs: a new class of gene expression regulators. Med. Sci. 2004;20:894–898. doi: 10.1051/medsci/20042010894. [DOI] [PubMed] [Google Scholar]
- 48.Pepperkok R, Ellenberg J. High-throughput fluorescence microscopy for systems biology. Nat. Rev. Mol. Cell Biol. 2006;7:690–696. doi: 10.1038/nrm1979. [DOI] [PubMed] [Google Scholar]
- 49.Starkuviene V, Pepperkok R. The potential of high-content high-throughput microscopy in drug discovery. Br. J. Pharmacol. 2007;152:62–71. doi: 10.1038/sj.bjp.0707346. [DOI] [PMC free article] [PubMed] [Google Scholar]
- 50.Oheim M. High-throughput microscopy must re-invent the microscope rather than speed up its functions. Br. J. Pharmacol. 2007;152:1–4. doi: 10.1038/sj.bjp.0707348. [DOI] [PMC free article] [PubMed] [Google Scholar]
- 51.Price JH, Goodacre A, Hahn K, Hodgson L, Hunter EA, Krajewski S, Murphy RF, Rabinovich A, Reed JC, Heynen S. Advances in molecular labelling, high throughput imaging and machine intelligence portend powerful functional cellular biochemistry tools. J Cell Biochem Suppl. 2002;39:194–210. doi: 10.1002/jcb.10448. [DOI] [PubMed] [Google Scholar]
- 52.Hall LL, Smith KP, Byron M, Lawrence JB. Molecular anatomy of a speckle. Anat. Rec. A Discov. Mol. Cell Evol. Biol. 2006;288:664–675. doi: 10.1002/ar.a.20336. [DOI] [PMC free article] [PubMed] [Google Scholar]
- 53.Bond VC, Wold B. Nucleolar localization of myc transcripts. Mol. Cell Biol. 1993;13:3221–3230. doi: 10.1128/mcb.13.6.3221. [DOI] [PMC free article] [PubMed] [Google Scholar]
- 54.Kadowaki T, Hitomi M, Chen S, Tartakoff AM. Nuclear mRNA accumulation causes nucleolar fragmentation in yeast mtr2 mutant. Mol. Biol. Cell. 1994;5:1253–1263. doi: 10.1091/mbc.5.11.1253. [DOI] [PMC free article] [PubMed] [Google Scholar]
- 55.Kadowaki T, Schneiter R, Hitomi M, Tartakoff AM. Mutations in nucleolar proteins lead to nucleolar accumulation of polyA+ RNA in Saccharomyces cerevisiae. Mol. Biol. Cell. 1995;6:1103–1110. doi: 10.1091/mbc.6.9.1103. [DOI] [PMC free article] [PubMed] [Google Scholar]
- 56.Ideue T, Azad AK, Yoshida J, Matsusaka T, Yanagida M, Ohshima Y, Tani T. The nucleolus is involved in mRNA export from the nucleus in fission yeast. J. Cell Sci. 2004;117:2887–2895. doi: 10.1242/jcs.01155. [DOI] [PubMed] [Google Scholar]
- 57.Brodsky AS, Silver PA. Pre-mRNA processing factors are required for nuclear export. RNA. 2000;6:1737–1749. doi: 10.1017/s1355838200001059. [DOI] [PMC free article] [PubMed] [Google Scholar]
Associated Data
This section collects any data citations, data availability statements, or supplementary materials included in this article.