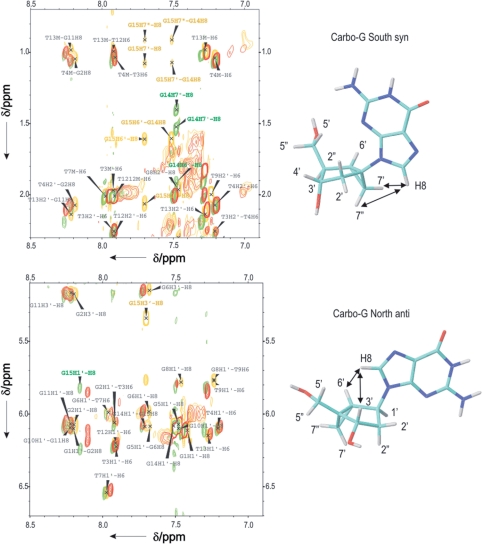
Figure 7.
Selected regions of NOESY spectra of unmodified TBA (red), TBA-dG15N (yellow) and TBA-dG15S (green). Locked-nucleotide resonances are labelled in their respective colour, according to the numbering scheme shown. The conformation of the glycosyl angle can be determined from some key strong NOEs, indicated with arrows.

