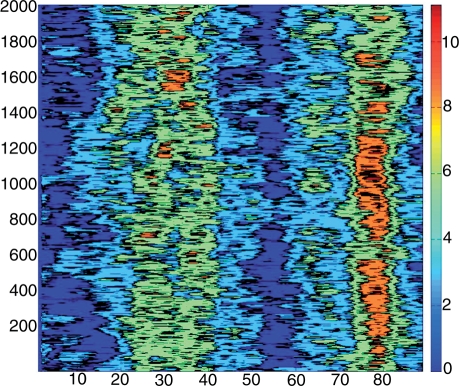
Figure 6.
Fluctuations of axis bend for all dinucleotide steps in an 89-bp minicircle during a 2 ns segment of a molecular dynamics trajectory. The base pair positions are given on the horizontal axis and time (ps) increases along the vertical axis. The colour bar shows the variations in bend from 0° (dark blue) to 11° (dark red).

