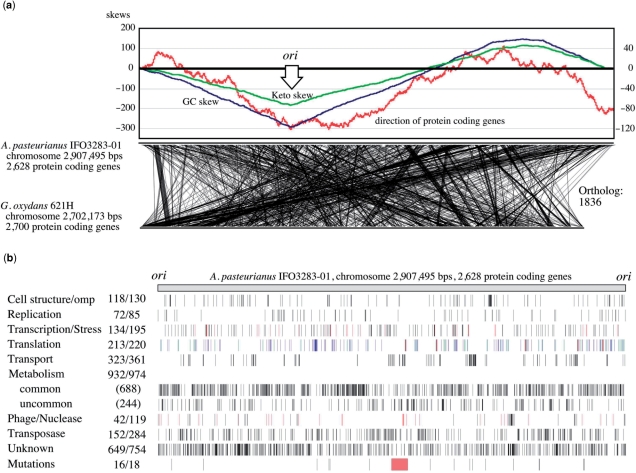
Figure 2.
Genome map and structure of A. pasteurianus IFO 3283-01 chromosome. (a) The origin of replication was determined based on three values from cumulus of the GC (blue) and keto (green) skews, and transcription directions (red), and shown as ori (47). The locations of orthologs are shown by linking between A. pasteurianus and G. oxydans (11). (b) Genes in the chromosome are mapped after gene categorization into nine groups such as cell structure, replication and so on. Transcription and stress are indicated in black and red, respectively. Genes in translation are separated into protein coding in blue, and 52 tRNA in green and 15 rRNA in red. Numbers next to the categories are the number of genes in the chromosome and whole genome on the left and right, respectively. Genes in ‘common’ of metabolism means that its orthologs are found in both genomes of Gluconobacter oxydans (11) and Granulibacter bethesdensis (12). The mutation loci identified in this work are also mapped. Genome variation by three SNPs in red, four transposon insertions in blue and five HTRs in green, and terminal deletion in red of the 42°C evolved strain.

