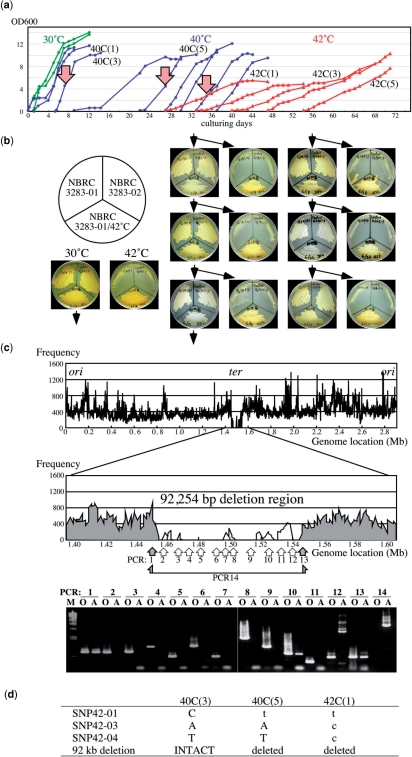
Figure 6.
Adaptation to an unviable environment at high-temperatures. (a) Growth profiles of A. pasteurianus IFO 3283-01 in the successful case for adaptation. Green, blue and red curves indicate cell growth at 30, 40 and 42°C, respectively. Three arrows, 40C(3), 40C(5) and 42C(1), indicate the cell cultures analyzed for mutations. (b) A heritability analysis of growth at 42°C. The seed strain (IFO 3283-01), the bred substrain (IFO 3283-01/42°C) and a different cell type strain (IFO32383-02) were inoculated on same plate and tested for growth at 30°C and 42°C. Cells grown on a 30°C plate were then inoculated onto the next two plates for growth at 30°C and 42°C. (c) A mapping analysis of sequencing reads on the chromosome of IFO 3283-01/42°C (top). Vertical and horizontal axes indicate chromosome location and frequency of high-quality sequence reads in 1000 bases. PCR analyses were carried out for the large deletion region and positions of primer pairs for PCR analyses were shown in the middle. DNA was used from the clone IFO 3283-01-42C isolated from the culture 42C(1) indicated by the right arrow in the panel a. Gray zones and gray arrows in the middle panel indicate existence of the region in the genomic DNA, while white areas, no-mapped regions and white arrow show the region deleted from the genome. PCR products analyzed in agarose gel electrophoresis were shown in the bottom. O and A on the top of each lane designate DNA templates for PCR prepared from the original (IFO 3283-01) and the adapted strain (IFO 3283-01-42C), respectively. (d) A summary of the mutations found in the adapted strain (IFO 3283-01-42C). Original and mutated sequences are shown in capital and small letters, respectively.

