
Table 1.
Summary of phenotypes and mutation loci in the IFO 3283 (NBRC 3283) multi-phenotype complex
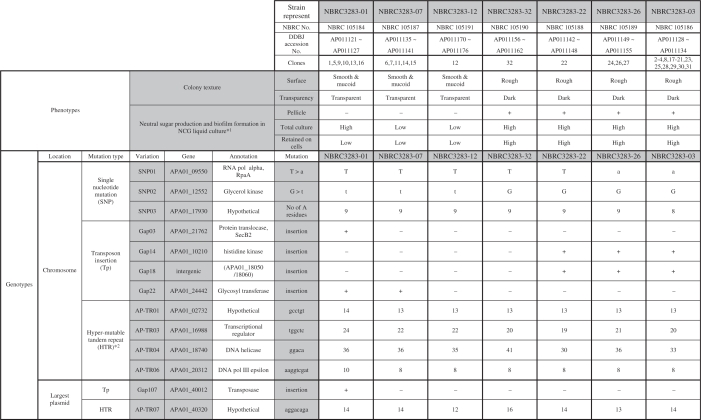 |
*1. High and low sugar production were determined based on the data of Figure 3b.
*2. Repetitive numbers of the representative substrains are indicated.