Figure 4.
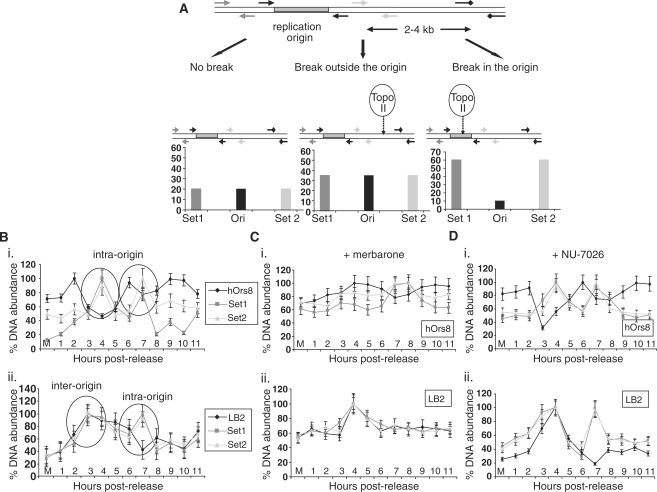
DNA-break formation during G1 phase. (A) Schematic diagram explaining the three different scenarios of the DNA-break labelling assay. No break formation (left) should lead to background levels of DNA immunoprecipitated by the anti-biotin antibody. In the case of a break in proximity to the origin, but outside of the core region (middle), increased amounts of the PCR products upstream (Set 1), downstream (Set 2) and flanking (Ori) the origin region should be produced, while an intra-origin break (right) should result in increased Set 1 and Set 2, but decreased Ori products. (B) Generation of putative DNA breaks in hOrs8 (i) and lamin B2 (ii) during G1 phase. Encircled are the two consecutive DNA breaks formed at the two chromosomal loci, two intra-origin breaks in hOrs8, and one inter-origin and one intra-origin in lamin B2. Values are expressed as ratios of the individual DNA abundances at each timepoint to the maximal abundance observed during the course of the assay, following normalization with the non-origin containing regions. Error bars represent 1 SD of three separate experiments. (C) Effect of merbarone on DNA-break formation at the hOrs8 (i) and lamin B2 (ii) replication origins. Error bars represent 1 SD of three separate experiments. (D) DNA-break labelling assay at the hOrs8 (i) and lamin B2 (ii) replication origins following NU-7026 treatment. Error bars represent 1 SD of three separate experiments.

