NEUROSCIENCE Correction for “Stomach ghrelin-secreting cells as food-entrainable circadian clocks,” by Joseph LeSauter, Nawshin Hoque, Michael Weintraub, Donald W. Pfaff, and Rae Silver, which appeared in issue 32, August 11, 2009, of Proc Natl Acad Sci USA (106:13582–13587; first published July 24, 2009; 10.1073/pnas.0906426106).
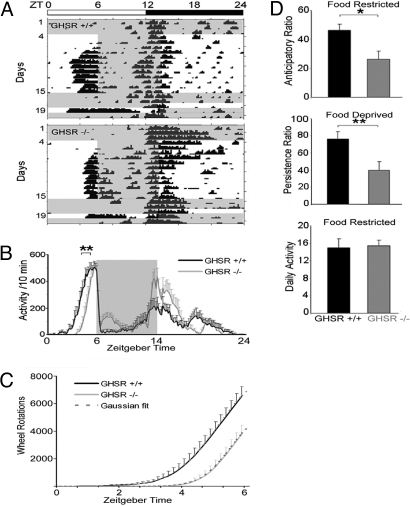
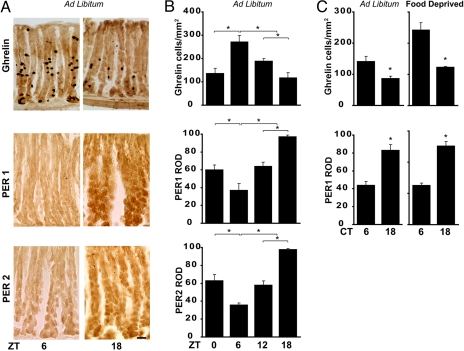
The authors note that on page 13583, in the legend for Fig. 2, an equation appeared incorrectly. The figure and its corrected legend appear below. Additionally, in Fig. 3A on page 13584, the panels labeled “Ghrelin” and “PER1” appeared incorrectly. The corrected figure and its legend appear below. These errors do not affect the conclusions of the article.
Fig. 2.
Running wheel behavior of wild-type and GHSR−/− mice during ad libitum feeding, food restriction, and food deprivation conditions. (A) The bar above the actograms shows the light–dark cycle; time of food availability is shown in gray. Actograms depict activity of representative GHSR+/+ and GHSR−/− mice during ad libitum feeding (days 1–4), food restriction ZT6–ZT14 (days 4–15), ad libitum food availability (days 15–18), and food deprivation (day 19). (B) Group activity profiles show the amount of wheel running during the last 7 days of restricted feeding in GHSR+/+ (black) and GHSR−/− (gray) mice. The data are plotted in 10-min bins (mean ± SEM). **, P = 0.002, difference between GHSR+/+ and GHSR−/− in onset time of activity. (C) Line graph of cumulative wheel-running activity (mean ± SEM) from lights on (ZT0) to time of food presentation (ZT6) shows that GHSR−/− mice (solid gray line) ran 42.4% less than GHSR+/+ (solid black line) mice. Superimposed are the curves derived from the Gaussian function f(x) = e−x2/2/ (dashed lines). (D) The anticipation ratios during 7 days of restricted feeding (Top) and the persistence ratio (Middle) on the day of food deprivation are shown for GHSR−/− (gray bars) and control GHSR+/+ (black bars) mice, with significant differences between groups. (Bottom) Daily activity during the period of food restriction. *, P = 0.02; **, P = 0.01.
Fig. 3.
Rhythmicity of ghrelin, PER1, and PER2 in oxyntic cells harvested at various ZTs and CTs in animals fed ad libitum or food-deprived. (A) Photomicrographs of a cross-section through the stomach wall show expression of ghrelin, PER1, and PER2, stained with diaminobenzidine (DAB), at 2 times of day—ZT6 and ZT18—in ad libitum-fed animals. (Scale bar: 20 μm.) (B) Quantification of ghrelin, PER1, and PER2 expression shows daily rhythms in these proteins. Note that peak expression of ghrelin occurs at ZT6, in antiphase with peak expression of PER1 and PER2. (C) Expression of ghrelin and PER1 at CT6 and CT18 in animals housed in DD for 48 h and then either fed ad libitum or food-deprived for 48 h. Note: Control sections are shown in Fig. S3. *, P < 0.05.


