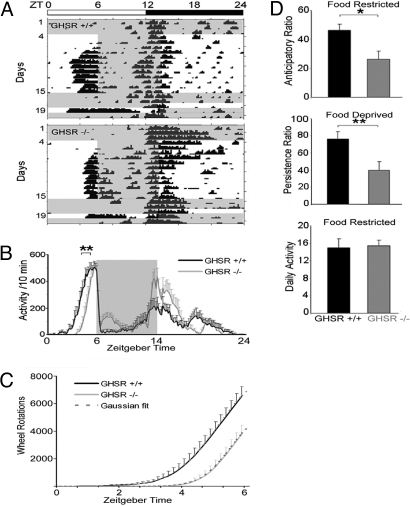
Fig. 2.
Running wheel behavior of wild-type and GHSR−/− mice during ad libitum feeding, food restriction, and food deprivation conditions. (A) The bar above the actograms shows the light–dark cycle; time of food availability is shown in gray. Actograms depict activity of representative GHSR+/+ and GHSR−/− mice during ad libitum feeding (days 1–4), food restriction ZT6–ZT14 (days 4–15), ad libitum food availability (days 15–18), and food deprivation (day 19). (B) Group activity profiles show the amount of wheel running during the last 7 days of restricted feeding in GHSR+/+ (black) and GHSR−/− (gray) mice. The data are plotted in 10-min bins (mean ± SEM). **, P = 0.002, difference between GHSR+/+ and GHSR−/− in onset time of activity. (C) Line graph of cumulative wheel-running activity (mean ± SEM) from lights on (ZT0) to time of food presentation (ZT6) shows that GHSR−/− mice (solid gray line) ran 42.4% less than GHSR+/+ (solid black line) mice. Superimposed are the curves derived from the Gaussian function f(x) = e−x2/2/ (dashed lines). (D) The anticipation ratios during 7 days of restricted feeding (Top) and the persistence ratio (Middle) on the day of food deprivation are shown for GHSR−/− (gray bars) and control GHSR+/+ (black bars) mice, with significant differences between groups. (Bottom) Daily activity during the period of food restriction. *, P = 0.02; **, P = 0.01.

