Fig. 2.
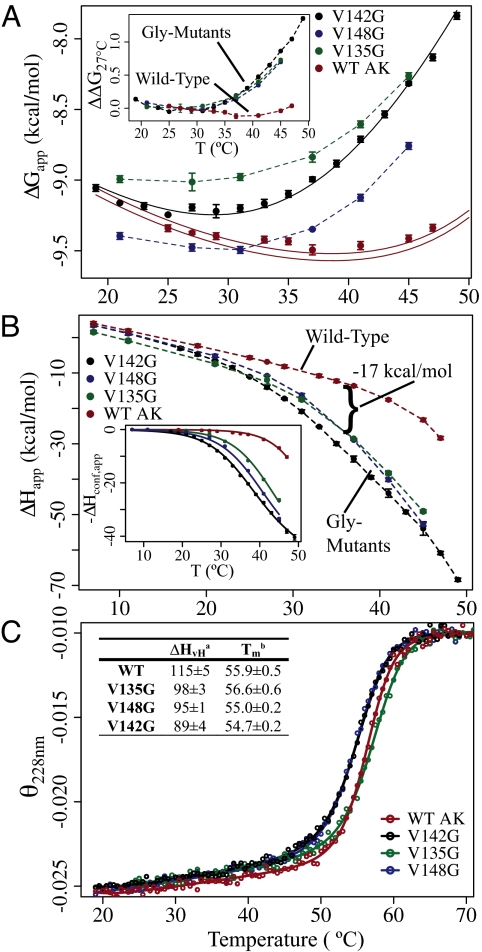
Distal mutations affect the thermodynamics of binding and folding. (A) Apparent free energy (ΔGapp) of binding. The solid black line shows the fitted curve for the v142g ΔG data. The solid red lines represent the prediction of WT data based on the fitting of ΔHconf,app. Lines represent the prediction, plus and minus the average standard error of determining ΔGapp. (Inset) Change in ΔGapp for each protein, with temperature, referenced from 27° C. ΔΔG27° C(Temp) = ΔG(Temp) − ΔG(27° C). (B) Apparent enthalpy of binding (ΔHapp) Ap5A. (Inset) Corrected data and fitting functions representing −ΔHconf,app (Eq. 2a). (C) Representative circular dichrosim thermal unfolding experiments (deg·cm2/dmol·res). Denatured state signals are normalized. Lines are fitting functions for a two-state thermodynamic model. (Table) Thermodynamic parameters determined from the two-state fits: a, van't Hoff enthalpy (kcal/mol) (at Tm); b, transition midpoint temperature (°C).

