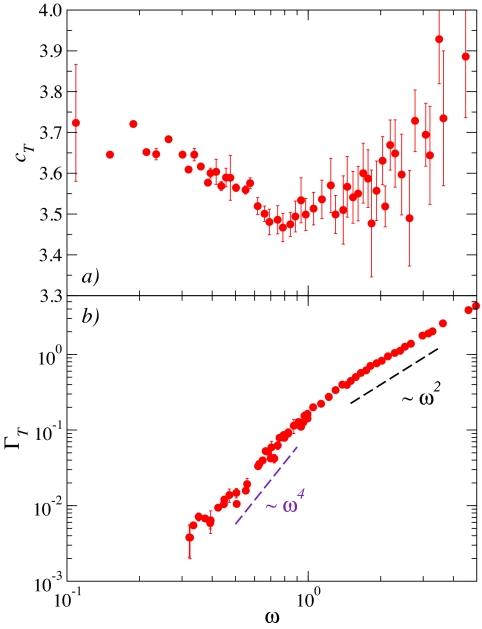
Fig. 2.
Phase velocity and broadening of the transverse acoustic-like excitations in a LJ glass. Frequency dependence of phase velocity (red circles in A) and FWHM (red circles in B) of the transverse acoustic-like excitations of the studied LJ glass. The dashed lines in B emphasize different regimes: ∼ω2 at high frequencies and ∼ω4 at low frequencies. The transition between the two regimes appears at the frequency where the phase velocity in A shows a minimum.

