Fig. 1.
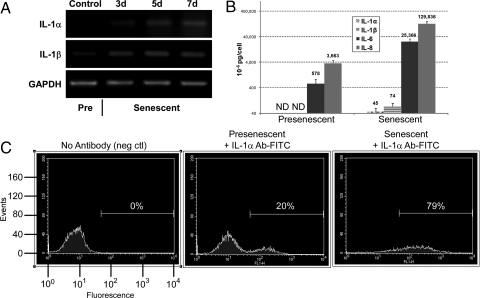
IL-1α and IL-1β mRNA and protein levels increase in senescent cells. (A) HCA2 fibroblasts were either untreated or treated with bleomycin (50 μg/ml) for 3 h. Total RNA was collected at the indicated intervals thereafter, and transcript levels for IL-1α, IL-1β, and GAPDH were determined by semiquantitative RT-PCR. Pre, presenescent cells. (B) Cells were either untreated or treated with bleomycin and allowed to recover for 6 d. Conditioned media were collected over the next 24 h and analyzed for IL-1α, IL-1β, IL-6 and IL-8 by ELISA. (C) Cells were either untreated or treated with bleomycin and allowed to recover for 7 d. The cells were collected, washed, incubated in PBS with or without FITC-labeled monoclonal antibodies against IL-1α, and processed by FACS analysis to determine the amount of cell surface-bound IL-1α. The low-intensity peak is background fluorescence for unlabeled cells. The histograms were gated as indicated by the horizontal lines and the percent of total fluorescence signal is shown.

