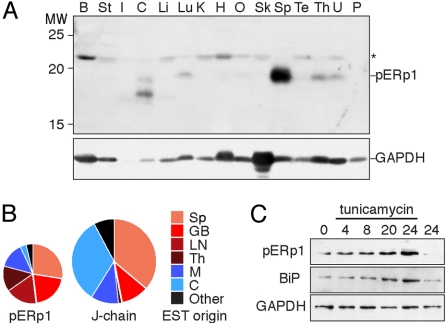
Fig. 3.
pERp1 is a lymphocyte-specific protein with highest abundance in the spleen. (A) Immunoblot analysis using α-pERp1 antiserum of a commercially available (Zyagen) blot with normalized amounts of proteins from various murine tissues (75 μg per tissue). Tissues are: B, brain; St, stomach; I, intestine; C, colon; Li, liver; Lu, lung; K, kidney; H, heart; O, ovary; Sk, skeletal muscle; Sp, spleen; Te, testis; Th, thymus; U, uterus; and P, placenta. The asterisk indicates a background band. The same blot was analyzed with an α-GAPDH antiserum for comparison. (B) All murine ESTs corresponding with pERp1 or J-chain were retrieved from the National Center for Biotechnology Information EST database on September 15, 2008. We categorized ESTs by tissue origin represented in pie diagrams. ESTs from cancerous or mixed origin were omitted from the analysis. Differences in size of pie diagrams are in proportion to the number of ESTs found for pERp1 (n = 29) and J chain (n = 64). Slices representing ESTs from lymphoid tissues are color coded in shades of red, from other secretory tissues in shades of blue, and from other sources in black. Tissues are abbreviated as in A except GB, germinal B cell; LN, lymph node; and M, mammary gland. (C) Immunoblot analysis using α-pERp1, α-BiP, or α-GAPDH antisera of lysates from I.29μ+ B lymphomas, before or after indicated time (hours) in the presence of the ER stressor tunicamycin (3 μg/mL) or after 24 h without the drug. The UPR target BiP serves as positive reference and GAPDH as loading control.

