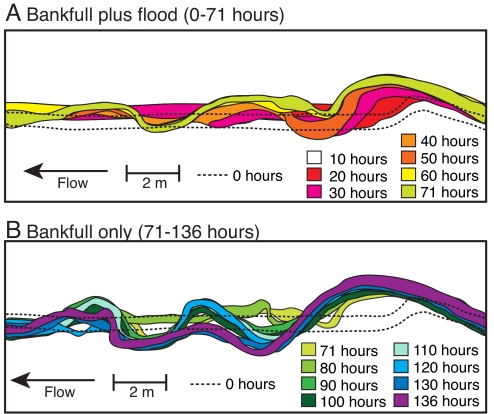
Fig. 1.
Map of channel position through time. (A) shows the channel position during the first 71 h of the experiment when discharge included both a bankfull and flood flow, while (B) shows channel evolution from 71–136 h when the discharge was a steady bankfull flow. The original carved channel boundary is represented by the dashed lines, and the channel margin at 10 h is not visible beneath the boundary at 20 h, when the channel width was expanding. The short-lived cutoff at 29 h is not visible in this figure. Chutes have not been included in the figure for clarity, but the morphology of chutes is shown in Fig. 3.

