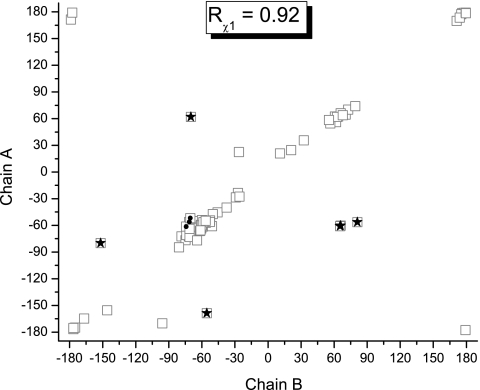
Fig. 1.
Plot of the χ1 torsional angles in degrees (as open-squares) from chain A versus chain B of the x-ray-determined structure of PDB ID 1RGE. We highlighted those residues showing differences greater than 2.0 ppm between predicted 13Cα chemical shifts from molecule A and B of 1RGE by CheShift with filled stars and filled circles. For details about the distribution of the black-filled symbols, see Protein 1RGE (Ribonuclease Sa).

